10-K: Annual report [Section 13 and 15(d), not S-K Item 405]
Published on March 13, 2026
UNITED STATES
SECURITIES AND EXCHANGE COMMISSION
Washington, D.C. 20549
FORM 10-K
ANNUAL REPORT PURSUANT TO SECTION 13 OR 15(d) OF THE SECURITIES EXCHANGE ACT OF 1934 |
For the fiscal year ended December 31 , 2025
OR
TRANSITION REPORT PURSUANT TO SECTION 13 OR 15(d) OF THE SECURITIES EXCHANGE ACT OF 1934 |
For the transition period from _____ to ______
Commission file number 001-42897
(Exact name of registrant as specified in its charter)
3582 | ||
(State or other jurisdiction of incorporation or organization) | (Primary Standard Industrial Classification Code Number) | (I.R.S. Employer Identification Number) |
Registrant’s telephone number, including area code: (920 ) 748-3121
Securities registered pursuant to Section 12(b) of the Act:
Title of each class | Trading Symbol(s) | Name of each exchange on which registered |
Securities registered pursuant to section 12(g) of the Act: None
Indicate by check mark if the registrant is a well-known seasoned issuer, as defined in Rule 405 of the Securities Act. Yes o No x
Indicate by check mark if the registrant is not required to file reports pursuant to Section 13 or Section 15(d) of the Act. Yes o No x
Indicate by check mark whether the registrant (1) has filed all reports required to be filed by Section 13 or 15(d) of the Securities Exchange Act of 1934
during the preceding 12 months (or for such shorter period that the registrant was required to file such reports), and (2) has been subject to such filing
requirements for the past 90 days. Yes x No o
Indicate by check mark whether the registrant has submitted electronically every Interactive Data File required to be submitted pursuant to Rule 405 of
Regulation S-T (§ 232.405 of this chapter) during the preceding 12 months (or for such shorter period that the registrant was required to submit such
files). Yes x No o
Indicate by check mark whether the registrant is a large accelerated filer, an accelerated filer, a non-accelerated filer, a smaller reporting company, or an
emerging growth company. See the definitions of “large accelerated filer,” “accelerated filer,” “smaller reporting company,” and "emerging growth
company" in Rule 12b-2 of the Exchange Act.
Large accelerated filer | o | Accelerated filer | o | |
x | Smaller reporting company | |||
Emerging growth company |
If an emerging growth company, indicate by check mark if the registrant has elected not to use the extended transition period for complying with any new
or revised financial accounting standards provided pursuant to Section 13(a) of the Exchange Act. o
Indicate by check mark whether the registrant has filed a report on and attestation to its management’s assessment of the effectiveness of its internal
control over financial reporting under Section 404(b) of the Sarbanes-Oxley Act (15 U.S.C. 7262(b)) by the registered public accounting firm that
prepared or issued its audit report. o
If securities are registered pursuant to Section 12(b) of the Act, indicate by check mark whether the financial statements of the registrant included in the
filing reflect the correction of an error to previously issued financial statements. o
Indicate by check mark whether any of those error corrections are restatements that required a recovery analysis of incentive-based compensation received
by any of the registrant’s executive officers during the relevant recovery period pursuant to §240.10D-1(b). o
Indicate by check mark whether the registrant is a shell company (as defined in Rule 12b-2 of the Act). Yes o No x
The registrant was not a public company as of June 30, 2025, the last business day of the registrant's most recently completed second fiscal quarter, and
therefore cannot calculate the aggregate market value of its voting common equity held by non-affiliates as of such date. The registrant’s common stock
began trading on The New York Stock Exchange on October 9, 2025.
As of March 6, 2026, there were 197,944,735 shares of Common Stock outstanding.
DOCUMENTS INCORPORATED BY REFERENCE
following the end of the registrant’s fiscal year ended December 31, 2025, are incorporated by reference in Part III of this Form 10-K.
1
Table of Contents
Page | ||
2
CAUTIONARY NOTE REGARDING FORWARD-LOOKING STATEMENTS
This annual report on Form 10-K (the “Annual Report”) contains “forward-looking statements” within the meaning of
the U.S. Private Securities Litigation Reform Act of 1995, as amended. Forward-looking statements include statements that
are not historical facts and can be identified by terms such as “anticipate,” “believe,” “could,” “estimate,” “expect,”
“intend,” “may,” “plan,” “potential,” “predict,” “project,” “seek,” “should,” “will,” “would” or similar expressions and the
negatives of those terms. The forward-looking statements are generally contained in the section captioned “Management’s
Discussion and Analysis of Financial Condition and Results of Operations.” Forward-looking statements include
information concerning our possible or assumed future results of operations, client demand, business strategies, technology
developments, financing and investment plans, our industry and regulatory environment, potential growth opportunities
and the effects of competition.
Forward-looking statements involve known and unknown risks, uncertainties and other factors that may cause our
actual results, performance or achievements to be materially different from any future results, performance or achievements
expressed or implied by the forward-looking statements. Given these uncertainties, you should not place undue reliance on
forward-looking statements. Also, forward-looking statements represent our management’s beliefs and assumptions only as
of the date of this Annual Report. You should read this Annual Report and the documents that we have filed as exhibits
hereto completely and with the understanding that our actual future results may be materially different from what we
expect.
Important factors that could cause actual results to differ materially from our expectations include:
•the high degree of competition in the markets in which we operate;
•our reliance on the performance of distributors, route operators, suppliers, retailers and servicers;
•our ability to achieve and maintain a high level of product and service quality;
•fluctuations in the cost and availability of raw materials;
•our exposure to international markets, particularly emerging markets;
•our exposure to costs and difficulties of acquiring and integrating complementary businesses and technologies;
•our exposure to worldwide economic conditions and potential global economic downturns;
•the impact of potential adverse relations with employees;
•the impact of tariffs and exchange rate fluctuations;
•the potentially significant costs of complying with environmental, health and safety (“EHS”) laws, including those
relating to energy and water usage and efficiency;
•our reliance on information technology systems and proprietary software;
•compliance with data privacy and security laws;
•our potential exposure to data security incidents;
•our substantial indebtedness;
•compliance with trade and export control laws;
•our principal stockholder has significant influence over us; and
•our status as a “controlled company” within the meaning of the NYSE corporate governance standards; and
•other factors disclosed in the section entitled “Risk Factors” (refer to Part I, Item 1A, of this Annual Report on
Form 10-K)
We derive many of our forward-looking statements from our operating budgets and forecasts, which are based on
many detailed assumptions. While we believe that our assumptions are reasonable, we caution that it is very difficult to
predict the impact of known factors, and it is impossible for us to anticipate all factors that could affect our actual results.
3
Important factors that could cause actual results to differ materially from our expectations, or cautionary statements, are
disclosed under the sections entitled “Risk Factors” and “Management’s Discussion and Analysis of Financial Condition
and Results of Operations” in this Annual Report. All written and oral forward-looking statements attributable to us, or
persons acting on our behalf, are expressly qualified in their entirety by these cautionary statements as well as other
cautionary statements that are made from time to time in our other Securities and Exchange Commission (“SEC”) filings
and public communications. You should evaluate all forward-looking statements made in this Annual Report in the context
of these risks and uncertainties.
We caution you that the important factors referenced above may not contain all of the factors that are important to you.
In addition, we cannot assure you that we will realize the results or developments we expect or anticipate or, even if
substantially realized, that they will result in the consequences or affect us or our operations in the way we expect. The
forward-looking statements included in this Annual Report are made only as of the date hereof. We undertake no obligation
to update or revise any forward-looking statement as a result of new information, future events or otherwise, except as
otherwise required by law.
Summary of Risk Factors
Our business is subject to a number of risks, including risks that may prevent us from achieving our business
objectives or may adversely affect our business, financial condition and results of operations, which could cause the trading
price of our common stock to decline and could result in a partial or total loss of your investment. You should consider
these risks before making a decision to invest in shares of our common stock. These risks are discussed more fully in “Item
1A. Risk Factors” in this Annual Report. The following is a summary of some of the principal risks we face:
•Risks Relating to Our Business.
◦We operate in a competitive market and the introduction of new products and technologies involves risks, and we
may not realize the degree or timing of benefits initially anticipated.
◦Our business depends on the performance of our third-party distributors, route operators and suppliers who are
subject to additional risks that are beyond our control, including those that could harm our business, financial
condition and results of operations.
◦We do not have long-term purchase commitments from our distributors, suppliers and retailers and may have to
rely on distributor, supplier and retailer forecast in making production decisions.
◦Price fluctuations or shortages of raw materials could adversely affect our operations.
◦ We face inventory risk caused by inherent uncertainty in inventory forecasting and production planning.
◦We depend on suppliers, including single-source suppliers and, in certain cases, sole-source suppliers, to
consistently supply us with components for our products.
◦Global economic downturns could negatively impact our suppliers and customers.
◦Failure to achieve and maintain a high level of product and service quality could damage our reputation with
customers, increase our costs or negatively impact our results and market share.
◦Our financing programs to end-customers expose us to additional risks.
◦Past growth may not be indicative of future growth.
◦We may encounter certain risks and incur certain expenses when implementing our business strategy to continue
to grow our international business, particularly in emerging markets. We are also adversely affected by ongoing
international conflicts and related disruptions in the global economy.
◦We are exposed to the risk of foreign currency fluctuations.
◦The costs and difficulties of acquiring and integrating complementary businesses and technologies.
◦A decline in future operating performance could result in impairment of goodwill or other intangible assets, which
could have a material adverse effect on our financial condition, results of operations or cash flows.
4
•Risks Relating to Government Regulation and Litigation.
◦Our international operations require us to comply with applicable trade, export controls and foreign anti-
corruption laws and regulations of the U.S. government and various other countries.
◦Tariffs and other trade restrictions could adversely affect our business and financial results.
◦We could incur costs in complying with environmental health and safety (“EHS”) laws and regulations.
◦ The risks related to environmental, social and governance (“ESG”) and sustainability laws, regulations, policies
and initiatives.
◦Energy efficiency, water usage standards and product-related standards could adversely affect our industry.
◦We are subject to risks of future legal proceedings.
◦Changes in accounting standards may adversely affect us. Our business may be impacted by new or changing tax
laws or regulations or by how judicial authorities apply tax laws.
•Risks Relating to Intellectual Property Matters.
◦Failure to adequately protect our intellectual property rights may have a material adverse effect on our results of
operations or our ability to compete.
◦Failure to protect the confidentiality of our trade secrets or other proprietary information could harm our business,
financial condition, results of operations and competitive position.
◦If our trademarks, trade names and domain names are not protected, maintained and enforced, we may not be able
to build name recognition in our markets of interest and our competitive position may be harmed.
•Risks Relating to Data Compliance, Cybersecurity and Artificial Intelligence.
◦Failure to comply with data privacy and security laws, regulations and other obligations.
◦Our use of AI technologies may not be successful, which may adversely affect our reputation and business.
•Risks Relating to Indebtedness.
◦Our credit agreements and other financing arrangements contain covenants, financial tests, and other restrictions
that may limit our ability to operate and grow our business; failure to comply could result in default, acceleration,
or increased borrowing costs and reduced liquidity.
◦Interest rate volatility, including changes in SOFR or other benchmark rates, could increase our interest expense;
any hedging strategies may be costly and may not fully mitigate this exposure.
•Risks Relating to Our Common Stock.
◦We may require additional capital to meet our financial obligations and support business growth, and this capital
may not be available on acceptable terms, if at all, and such additional capital and other equity issuances we make
may cause dilution to existing stockholders.
◦ Our stock price could be extremely volatile and, as a result, you may not be able to resell your shares at or above
the price you paid for them, and you could lose all or part of your investment as a result.
◦Future sales, or the perception of future sales, by us or our existing stockholders of a substantial amount of our
common stock in the public market could cause the price of our common stock to fall.
◦Our principal stockholder currently controls the direction of our business. Our principal stockholder’s interests in
our business may conflict with the interests of our other stockholders, and we are a controlled company under the
governance standards of the NYSE.
◦The requirements of being a public company may strain our resources, increase our costs, divert management’s
attention, and affect our ability to attract and retain executive management and qualified board members.
5
•Risks Relating to our Organizational Structure.
◦Some provisions of Delaware law, our Stockholders Agreement and our amended and restated certificate of
incorporation and bylaws may deter third parties from acquiring us and diminish the value of our common stock.
Part I
Item 1. Business
Our Company
Every Day is Laundry Day.
We are the world’s largest designer and manufacturer of commercial laundry systems, serving a diverse and resilient
range of global end markets. We believe we engineer and produce the highest quality and one of the most reliable
commercial laundry systems in the industry. We leverage our pure play focus on the commercial laundry industry and over
100 years of engineering excellence to drive innovation and design our equipment to deliver outstanding performance in
the most demanding applications. We believe the need for clean laundry is universal and growing, and our premium
machines meet this fundamental human need, all day, every day.
According to a third-party market study, the total addressable market for commercial, residential and industrial laundry
systems was approximately $82 billion in 2023. Within this market, the commercial laundry systems industry generated
nearly $7.4 billion in revenues during the same year. We are focused on this large and attractive commercial laundry
market where our systems’ quality, durability and reliability are key strategic advantages with our channel partners,
customers and end users. End users of our systems include healthcare facilities, fire stations, hotels, laundromats,
communal laundry facilities and many other commercial applications where hygiene is critical. We believe the criticality of
laundry equipment to these users’ operations creates a discerning customer base that appreciates the quality and economic
attractiveness of highly effective and reliable equipment. We leverage our scale and focus to deliver a compelling total
value proposition to this diverse customer base.
We estimate that we hold approximately 40% of the commercial laundry market in North America and have leading
positions in growing markets around the world. The commercial laundry market benefits from a regular replacement cycle
driven by a large base of installed machines, which provides us with an advantage as the largest incumbent manufacturer
and offers us a high level of revenue consistency to support our growth ambitions. In addition, residential customers are
increasingly demanding commercial-quality products for the home, and our machines represent a compelling fit for this
select but growing segment of the residential market.
Commercial laundry customers view laundry systems as infrastructure to support core business operations or as
revenue-generating assets. Avoidance of downtime and repair costs, as well as effective processing of large volumes of
laundry, are important drivers of machine economics and help our end-customers run their businesses effectively.
As such, customers focus on total cost of ownership when making purchasing decisions, which often involve
investments of hundreds of thousands of dollars.
Our systems are known for their use of high-quality materials in their construction, their build quality and the
extensive testing regimen they undergo, resulting in best-in-class performance. Our culture of operational excellence and
continuous improvement supports the maintenance of these exceptionally high-quality standards. As a result, we believe
we offer an attractive total cost of ownership, and our customers purchase our machines because of their reliability,
durability and effectiveness. This dynamic allows us to sell our products at a price premium versus competitor offerings
while securing a high degree of loyalty from our customers when they need to replace a machine.
We sell our systems through an extensive global network of approximately 600 distributors and through direct sales
channels in certain key markets. Distributors are a critical part of the commercial laundry market as they are frequently the
first point of contact for end-customers and are highly influential in educating those customers about equipment features
and highlighting the key factors in making a purchasing decision. We have valuable and difficult-to-replicate relationships
with our distributors that have been built over decades. Approximately 94% of our North American distributors have been
with the Company for ten years or more. Our distribution partners often see us as the vendor of choice given our focus on
quality, insights into customer needs, the attractive economics of our machines and our support teams staffed with highly
trained personnel. Our direct sales channel complements our distribution network by bringing us closer to end-customers
and enhancing strategic flexibility, particularly in select markets that we believe represent significant growth opportunities.
6
We operate through two geographic reporting segments with our North America segment representing 74% of 2025
revenue and our International segment representing the remaining 26%. Our historical financial performance has benefited
from consistent and predictable growth at attractive margins, and we have a strong cash generation profile accompanied by
minimal capital expenditure requirements given our well-invested manufacturing footprint. For the twelve-month period
ended December 31, 2025, our net revenue was $1.7 billion, net income was $101.8 million (with a net income margin of
approximately 6%), Adjusted EBITDA was $436.5 million (with an Adjusted EBITDA Margin of approximately 26%) and
capital expenditures were approximately 3% of net revenue. See “Management’s Discussion and Analysis of Financial
Condition and Results of Operations—Non-GAAP Financial Measures and Key Operating Metrics” regarding our use of
Adjusted EBITDA and Adjusted EBITDA Margin, which are non-GAAP financial measures, and a reconciliation of these
measures to their most directly comparable financial measure calculated in accordance with GAAP.
Our History
Our business began in 1908 in Ripon, Wisconsin when we introduced a hand-operated washer to the marketplace.
Industry leading features were introduced under the Speed Queen brand with the introduction of stainless steel wash tubs in
1938 and automatic washers and dryers in 1952. The spirit of innovation, quality and reliability persists to this day. We
manufacture durable products with high-quality steel that are meticulously tested and augmented by novel technologies.
More recently, we introduced our pioneering ProCapture lint capture technology in 2023 and have developed our digital
platform that can be leveraged across our brands to monitor product performance, business revenues and provide fleet
management efficiencies, among other benefits. We sell our highly engineered products across a portfolio of five strategic
brands: Speed Queen (which, according to a third-party market study, has the highest Net Promoter Score in North
America), Huebsch, UniMac, IPSO and Primus.
Business Segments
We operate in a global market that is estimated to be worth nearly $7.4 billion and our business is organized into two
reportable segments: North America and International.
North America
Our North America segment consists of the United States and Canada. We have sales and support teams based both at
our Ripon, Wisconsin locations and remotely to support our end markets though a mixture of independent distributors,
direct sales to communal laundry room operators and our company-owned distribution offices. While the majority of
products sold in the North America segment are produced in our U.S. manufacturing facilities, some specialist machines
are sourced from our other global facilities. We believe we are the number one supplier of commercial laundry equipment
in terms of market share in North America.
International
Our International segment comprises all countries outside of the United States and Canada. Sales are primarily made
through independent distributors who cover an allocated territory, usually in either a single country or region, and who we
support through regionally based sales and support teams. Additionally, we have direct sales offices in three key European
markets (France, Spain and Italy) and Brazil, where we believe the opportunity justifies our direct presence. As with our
North America segment, we operate a multi-brand strategy in each market, with multiple distributors representing one or
more brands. The majority of our systems sold in each region are made at our facilities in that region. We believe we are
the number one supplier of commercial laundry equipment in terms of market share in Latin America and Asia Pacific
(excluding China), and the number three supplier in Europe.
Our Industry
The commercial laundry systems industry, which, according to a third-party market study, generated nearly $7.4
billion in revenues in 2023, is comprised of three core end markets that cover the products and services the Company
provides:
•On-Premise Laundry (“OPL”): Businesses or institutions that process large volumes of laundry in support of their
core business, including healthcare facilities, fire stations and hotels;
•Vended: Businesses, such as laundromats and communal laundry operators, that operate commercial systems for
end users who pay for use; and
7
•Commercial In-Home: Residential consumers who pay a premium to have the reliability and effectiveness of
commercial systems in their homes.
On-Premise Laundry
OPLs are operated by end users in a wide range of distinct sectors, including healthcare facilities, fire stations, hotels
and any other sector where clean laundry is critical to supporting the end user’s core business. Ultimately, if the laundry
systems of OPL customers are not functioning, their businesses cannot operate.
User requirements in this segment vary significantly in terms of load capacities, cycle times, water efficiency and other
features, some of which can be driven by regulation or other policies. For example, the ability to sterilize large volumes of
linens in healthcare and the ability to wash highly specialized firefighting gear are both critical to health and safety but also
require distinct capabilities. OPLs choose commercial laundry systems based on ability to meet these specific industry
requirements, as well as total cost of ownership, manufacturer reputation and reliability.
Vended
The Vended market includes laundromat businesses and communal laundry operators, which manage laundry facilities
in apartments, universities and other institutions. Both laundromats and communal laundry operators utilize a pay-per-use
model to generate revenue, meaning if their laundry systems are down, they lose the ability to generate revenue and will
need to incur additional costs to get back up and running. As such, reliability and durability are key purchasing criteria to
minimize equipment downtime and the need for costly repair visits.
The laundromat market in North America represents a large installed base, estimated to be 1.1 million machines in the
United States alone, according to a third-party market study. A significant portion of the installed base is replaced each
year, generating a large and attractive recurring revenue stream where market position, scale, incumbency, product
reliability and brand reputation are important to retain and gain market share as machines are replaced.
In developed laundromat markets there is a secular shift away from traditional sole proprietor models to
professionalized operators managing multi-site operations. These professional operators are upgrading and expanding store
formats, adding higher capacity machines and leveraging digital tools to earn more revenue per store. In addition to the
shifting operating models for laundromats in developed markets, many emerging economies are in the early stages of
laundromat penetration, representing a significant opportunity for future growth.
Communal laundry facilities are managed primarily by operators who purchase, own, install and service the equipment
under contracts with property owners or management companies. Sophisticated route operators with multiple locations are
increasingly seeking technology, such as remote monitoring and digital control, to unlock cost savings and other operating
efficiencies. Internationally, high-density metropolitan regions are seeing growth in multi-unit housing with small sized
living units, driving demand for communal laundry facilities.
Commercial In-Home
The Commercial In-Home market is comprised of households and individual users who purchase commercial units to
meet their reliability, quality and heavy-duty laundry needs.
In-home customers have become increasingly frustrated with traditional residential machines, which are typically sold
based on lowest price or most features, but have lower-quality construction mainly comprised of plastic materials.
Frustration with traditional residential machines is generating strong demand for commercial systems from customers who
are willing to pay a premium for high quality, durable, reliable and long-lasting laundry systems.
Products and Services
We offer a full line of stand-alone commercial laundry systems, as well as provide the service parts and value-added
aftermarket services those systems require. Our products range from small-chassis washers and dryers to large-chassis
laundry equipment with load capacities of up to 400 pounds. Our small-chassis systems utilize smaller frame designs, while
our large-chassis systems are constructed on frames built to withstand significant load sizes. Most of our large-chassis
products are designed to withstand up to 30,000 cycles, with some rated up to 48,000 cycles.
8
Washers
Washer Extractors.
Our washer extractor products are used to process 20 to 400 pounds of laundry per load. In addition to washing
laundry, these products also extract water from the laundry with spin speeds that produce up to approximately 500 G-force,
which reduces water retention, drying time and energy costs. We build our washer extractor products to be extremely
durable to handle this high level of G-force, which they frequently endure many times a day given our systems are in
constant use. The durability of our washer extractors reduces breakdowns and malfunctions that can increase operating
costs and machine downtime. We sell our washer extractors to a variety of end markets and customers. We sell smaller
washer extractors that process up to 100 pounds of laundry per load to laundromats, while we sell our larger washer
extractors that process up to 400 pounds of laundry per load to on-premise laundry customers. We also produce a
specialized hygienic washer extractor, often called a medical barrier washer, for the healthcare industry.
Topload Washers.
Topload washers are small-chassis products with the capability to process up to 16 pounds of laundry per load with
spin speeds that produce up to approximately 200 G-force. These products are sold primarily to operators of communal
laundry rooms in the Vended end market and to individual consumers in the Commercial In-Home end market. Our topload
washers are available with a traditional wash system or with a “smart” inverter drive system that adjusts the water level and
wash action to match load size. We have recently added matte black machines to our product range, providing consumers
with more aesthetic optionality.
Our topload washers are among the highest rated Commercial In-Home washers available on the market. Consumer
Reports ranked Speed Queen as the most reliable appliance brand for the six years the designation was awarded.
Additionally, Speed Queen has the highest Net Promoter Score in North America, according to a third-party market study.
Many of our Commercial In-Home topload washers are ENERGY STAR™ certified. The ENERGY STAR™
certification, which is issued by the U.S. federal government, denotes products that use less energy, helping users reduce
the impact on the environment and save money on utility bills.
Frontload Washers.
Frontload washers are small-chassis machines that a user loads via a door at the front of the machine. Our frontload
washers can be purchased with a matching small-chassis dryer or a customer can purchase a stacked system, which
includes both a small-chassis frontload washer and dryer in a single unit.
Many of our Vended and OPL frontload washers are also ENERGY STAR™ certified.
Dryers
Tumblers.
Tumblers are large dryers with the capability of drying up to 200 pounds of laundry per load. Tumblers are sold
primarily to laundromats and on-premise laundry facilities under all five of our brands.
Our tumblers have industry-leading technology capabilities. Our Over-Dry Prevention Technology (“OPTidry”) is a
novel design that more accurately gauges load dryness. Our ProCapture technology, a patent-pending technology we
introduced in 2023, captures over 90% of dryer lint on first-run drying cycles compared to approximately 63% in
conventional lint screen solutions. Increased lint capture helps reduce service, maintenance and cleaning costs.
Small-Chassis Dryers.
Small-chassis dryers are smaller capacity machines with the capability of processing up to 18 pounds of laundry per
load. These products have capacity of 7.0 cubic feet, among the largest capacity for a small-chassis system in the industry.
Many of our residential small-chassis dryers are ENERGY STAR™ certified.
Combination Washer and Dryer
In 2021, we introduced a combination washer extractor and tumbler in two capacities. Our combination washer and
dryers offer a unique space saving solution that combines large capacity commercial washing and drying functionalities
9
into a single drum. These units are marketed primarily under our Speed Queen brand and are sold in our Asia Pacific and
Latin American markets.
Touch Screen Technology
Our touch screen control platform on washer extractors and tumblers is a best-in-class touch LCD control that provides
unprecedented value to our customers by providing ease of use and programming and increased revenue generating
options. This control platform works in tandem with our proprietary cloud-connected technology solutions that link over
200,000 machines globally, serving more than three million users.
Service Parts and Aftermarket
We sell the service parts used to support our estimated eight million unit installed base of equipment, which we
calculate assuming a ten-year average useful life of our products. We estimate that the market replacement rate of our
equipment is seven to thirteen years, meaning there is a substantial useful life over which we need to provide the parts to
service equipment. The demand for service parts generated by our large installed base provides us with a source of
recurring, predictable and higher margin revenue. In total, our aftermarket parts program supports the sale of more than
150,000 parts online.
Consumables
We also see a growing demand for detergents, softeners and other chemicals across both the OPL and Vended end
markets. In the OPL end market, we see growth in demand for direct injection of chemical products, which has long been
the preferred solution in many applications. In the Vended end market, a growing trend towards chemical inclusive pricing
in both developed and new markets is driving demand for the high margin recurring sales.
Other Value-Added Services
We believe that we offer an unmatched range of complementary services and customer support. We believe these
services—such as equipment financing, laundromat site selection assistance, investment seminar training programs,
computer-aided commercial laundry room design, sales and service training for distributors, technical assistance and on-
call installation and repair service—are significant drivers of high customer satisfaction and retention. Among these, our
equipment financing program is a particularly valuable offering, enabling customers to access and finance essential
equipment through flexible arrangements tailored to their operational needs. We believe this program has contributed
positively to our revenue growth and supports our broader strategy of delivering comprehensive solutions to our customer
base. Our philosophy is to anticipate our customers’ needs and provide them with services far beyond traditional customer
support.
In addition to our highly desirable physical laundry systems and extensive support infrastructure, we also offer market
leading technology solutions across our OPL and Vended end markets. Our technology strategy is centered around
leveraging our connected machines to provide a comprehensive suite of technology offerings designed for different end
markets. Speed Queen Insights, Huebsch Command, Primus i-Trace and IPSO Connect provide industry-leading control
and insights to Vended laundry customers through functionalities such as performance reporting, issue and error alerts,
machine control and programming, a mobile payment platform with an integrated loyalty program and an integrated CRM
and marketing system. UniMac Core is a cloud-based monitoring and reporting management tool that helps on-premise
laundry managers take control of laundry efficiency by allowing them to manage their laundry operations from anywhere
and at any time. UniMac’s FireLinc™ system gives fire departments a powerful tool that makes record keeping simple
through digital capabilities and fire equipment bar code scanning. We also have a financing website for our existing
laundromat customers, which allows them to manage bills, statements and account balances. We continue to enhance our
digital offerings with a focus on sustainability solutions, automation technologies, and ecosystem integrations that
differentiate our offerings in the commercial laundry space.
Our digital products have demonstrated strong market adoption and drive incremental recurring revenue through
subscription services while deepening customer relationships and loyalty to our equipment ecosystem. Our chargeable
Partner API Ecosystem enables third-party developers to integrate with our platform, giving them access to remotely
control and program machines and analyze performance data in their products, creating additional value for our customers,
especially in international markets where localized payment options require bespoke solutions that would not be
economical for us to support, and new revenue streams for our business. Our cybersecurity investments ensure the integrity
and reliability of our connected platforms, while our centralized data analytics capabilities enhance our internal visibility
into equipment performance and market trends to inform future product innovations. This convergence of physical and
10
digital innovation creates significant competitive barriers, as customers benefit from an integrated ecosystem that becomes
increasingly valuable over time, strengthening our market position across all segments.
Our Competitive Strengths
We Offer a Premier Portfolio of Commercial Laundry Systems
In commercial laundry, product and service quality are critical. Our systems are engineered for efficiency, reliability
and long-lasting performance to ensure these high standards are met. This starts in our engineering department where we
have designed and developed features that improve the durability, reliability and utility of our systems, and extends through
to the quality of our materials and manufacturing. Our services are comprehensive and add value to customer operations,
starting with site selection, design and financing, and extending through the lifecycle with genuine parts, technical support
and warranties. As a result, we have tremendous customer allegiance and brand loyalty.
Our Unparalleled Scale is Advantageous
In our commercial end markets, we are approximately two times larger than the next competitor, and in total have an
estimated installed base of eight million units, which we calculate assuming a ten-year average useful life of our products,
across approximately 150 countries. As a result, there is a sizeable ecosystem of operators, technicians and users of our
equipment who interact with our systems every day, resulting in highly sticky relationships. Our installed base also helps to
generate sizeable replacement cycle tailwinds as customers upgrade their Alliance systems over time. Moreover, it allows
us to support a scaled research and development and manufacturing effort, investing in engineering advancements that
meaningfully improve the customer value proposition.
We Have a Global Manufacturing Footprint and Rigorous Testing Capabilities
We operate six strategically located facilities globally and we believe we are the only manufacturer that produces
commercial equipment across North America, Europe and Asia Pacific. This “local for local” strategy delivers supply chain
resiliency and strengthens our cost position. Our manufacturing footprint spans approximately 2.7 million square feet and
our facilities have significant vertical integration, which enables greater control over the manufacturing process. The
quality control process within our facilities is world-class and includes AI-powered defect monitoring, tests on 100% of
machines produced and randomized audits, including full teardowns of finished products. We maintain approximately 800
dedicated testing bays, and we have ‘24x7’ testing capability across the globe, a critical capability that supports our mission
to offer the highest quality products in the industry.
Global Manufacturing Footprint
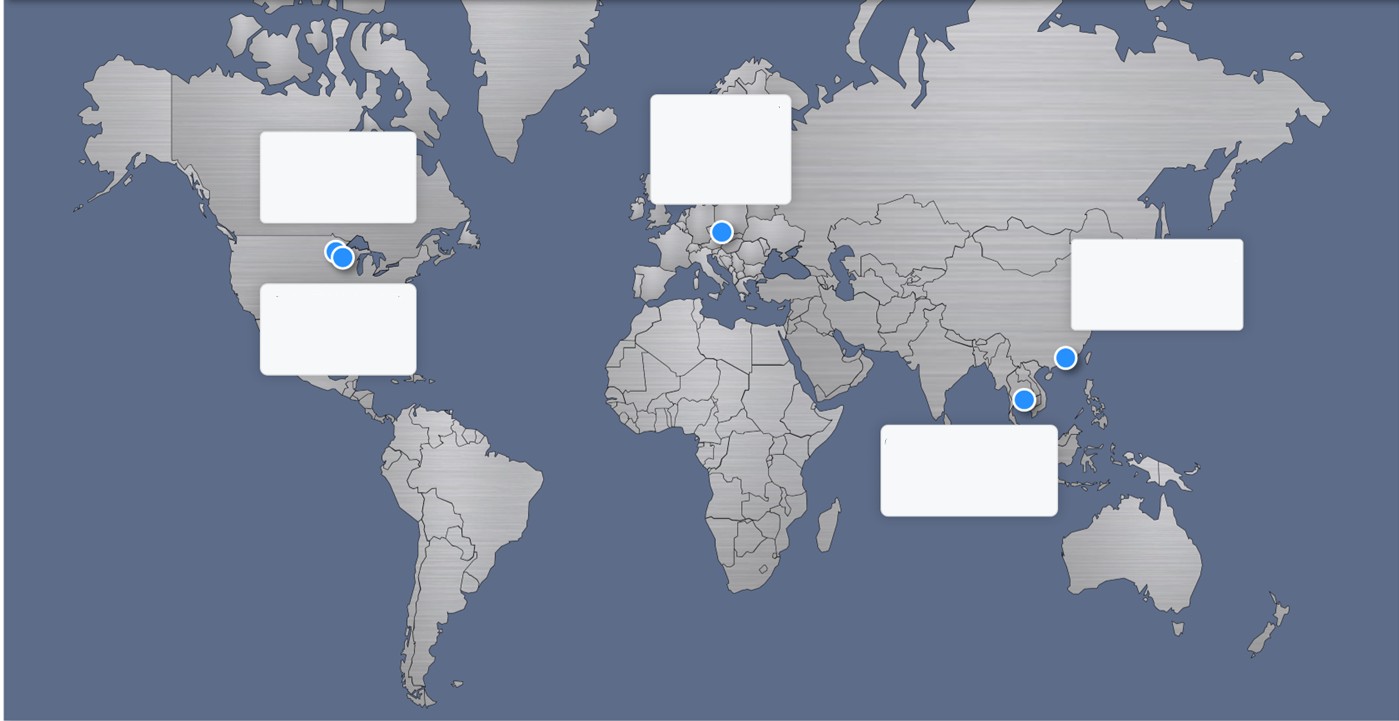

PRIBOR, CZECH
REPUBLIC
383k
sq. ft

RIPON, WI #1 &
#2
1,567k
sq. ft

GUANGZHOU, CHINA
60K
sq. ft

MANITOWOC, WI
426k
sq. ft

CHONBURI, THAILAND
278k
sq. ft
11
We Employ a Tailored Go-to-Market Strategy with Established Channel Relationships
Our success is enabled by our global channel partner network and direct sales channels. We have built a hard-to-
replicate network of approximately 600 independent distributors worldwide that sell into approximately 4,000 independent
retail locations. Our relationships with many of our distributors and their sales teams and technicians are long-standing, and
we continue to invest in resources to assist them with training, which results in a deep understanding of our technology and
trust in our systems. Our channel partners are also structurally incentivized to sell our systems because end-consumers
value our products’ superior total cost of ownership metrics and our partners benefit from our products’ attractive
economics. We supplement our expansive independent distribution and retail network with our direct sales offices and
direct sales to communal laundry operators to enhance strategic flexibility and access underpenetrated markets.
We Have a Proven Track Record of Innovation and Application Engineering Expertise
Innovation is a core focus of our business and we have history of developing industry-leading products and digital
tools that address the specific needs of our customers. For example, our recently introduced ProCapture Cyclonic Filtration
technology captures over 90% of lint on first-run drying cycles—compared to approximately 63% in traditional machines
—helping reduce maintenance frequency, lower labor costs and mitigate operational risks from lint buildup in high-usage
environments. We complement our equipment innovation with a proprietary suite of digital tools that simplify operations
and maximize profitability for multi-store laundromat owners and communal laundry room operators. Our integrated
platform enables customers to remotely adjust pricing, process payments, monitor machine usage and identify maintenance
needs in real time. Ultimately, these innovations, tailored to the distinct application requirements of our customers,
strengthen relationships and drive long-term value across our ecosystem.
We Have Demonstrated Consistent Best-in-Class Financial Performance
Alliance has demonstrated exceptional performance over time, with a revenue compound annual growth rate of
approximately 9.7% over our fifteen most recent fiscal years, as well as a net income margin in 2025 of approximately 6%
and an Adjusted EBITDA Margin in 2025 of approximately 26%. See “Management’s Discussion and Analysis of
Financial Condition and Results of Operations—Non-GAAP Financial Measures and Key Operating Metrics” regarding
our use of Adjusted EBITDA Margin, which is a non-GAAP financial measure, and a reconciliation to its most directly
comparable financial measure calculated in accordance with GAAP. Our consistent financial performance through
economic cycles is due to the mission-critical nature of our products, our focus on operational excellence, the reliability of
replacement cycle revenue and the benefits of a diversified end market and customer base. Our operational teams drive
continuous improvement and efficiency to enhance profitability, while our sales teams focus on winning high-margin
customers. Our business model is capital efficient, with capital expenditures equaling on average approximately 3% of net
revenue over the last three years.
We Have a Seasoned and Experienced Management Team
We are led by a team of industry veterans with decades of combined experience in the commercial laundry space. The
team has fostered a customer-focused culture that has delivered exceptional and consistent financial performance through
the cycle. Our leadership team has executed a number of strategic initiatives, including new product and technology
launches, expansion into new international markets, acquisitions and integrations of complementary businesses and the
implementation of lean manufacturing processes throughout our operations to drive greater efficiency, among others.
Our Growth Strategies
We have a long track record of growth because of the strength of our business model and organization. We intend to
extend our leadership position in the market by leveraging the following growth strategies:
Maintain Relentless Focus on Product Quality to Drive Share Gains
Demand in the commercial laundry systems market is driven by the replacement cycle. We expect existing customers
to continue to purchase our machines and new customers to migrate to us from our competitors at the time of replacement.
Our existing customers return and we win new customers due to the performance of our machines over their life cycles,
which require fewer expensive maintenance events and offering greater uptime over a longer operating life. In a poll of
industry customers, equipment performance was ranked as the most important purchasing factor.
12
Continue to Develop Innovative Products to Accelerate the Replacement Cycle
Given our scale and focus, we have been able to make significant investments in the development of new technologies
and capabilities that accelerate the replacement cycle of our machines. Between 2021 and 2025, we spent over $115 million
on research and development. The engineering advancements resulting from this investment have real utility to our
customers, improving performance and accelerating the replacement of existing systems.
Support the Ongoing Evolution of the Laundromat Market
We believe there is a compelling shift underway in the laundromat industry as sophisticated, commercially-focused
investors revamp store designs and the laundromat user experience. Leveraging our unparalleled scale, we will continue to
support this new class of entrepreneurs to build and expand their businesses across multi-site operations with larger store
footprints and larger capacity machines. We are well positioned to capitalize on this trend, offering a full suite of set-up
services, including: site selection, design, operator training and equipment financing, which enable operators to scale faster.
Additionally, our comprehensive digital platform enables management of multi-site operations and lowers operational cost
through remote monitoring, digital payments and data-driven decision making.
Serve Growing Demand for Commercial Machines from Commercial In-Home Customers
We believe there is an exciting opportunity to significantly expand our share in the residential market, as demand for
our commercial laundry systems is growing from users who are becoming increasingly frustrated with lower quality
residential machines. We serve this market with commercial machines, generating commercial-like margins and satisfying
the demands of homeowners that are focused on reliability and total cost of ownership.
Penetrate and Develop High-Potential International Markets
The global commercial laundry industry remains underpenetrated in many regions, presenting meaningful long-term
growth opportunities. We focus on high-potential geographies where structural trends—such as rising GDP, population
growth, urbanization, increasing household income, and evolving lifestyles—point to growing demand for commercial
laundry solutions. In these markets, our local teams help to establish and scale the commercial laundry ecosystem. For
example, in Thailand, we provided operational training, digital tools and other support to local laundromat entrepreneurs to
accelerate the creation of the laundromat industry.
Drive Consistent Operational Improvements to Further Expand Margins
We intend to further expand margins through the continued implementation of cost-down initiatives and an ongoing
focus on operational excellence. We will build on our demonstrated track record of durable margin improvement through
several initiatives, including: monitoring our global supply chain to identify raw material cost saving opportunities,
enhancing labor efficiency by optimizing plant operations, further automating our manufacturing facilities to improve
productivity, leveraging our engineering capabilities to develop more cost effective products and eliminating component
redundancy.
Sales and Marketing
We go to market through our independent distributors, direct sales offices and direct sales to scaled communal laundry
route operators.
Our independent distributor and route operator customers are supported by teams of regional sales managers and our
broader complementary support offering, which includes equipment financing, laundromat site selection assistance,
investment seminar training materials, commercial laundry room design, sales and service training and technical assistance.
Our direct distribution offices also benefit from this complementary infrastructure to support their sales, service and install
personnel employed to support key markets.
In the Vended and OPL end markets, our distributors sell directly to the operators of the laundry systems, whereas in
the North American Commercial In-Home market they utilize a network of independent appliance retailers to sell to end
consumers.
We support our sales force and distributors through a full complement of marketing activities. These activities take a
variety of forms such as traditional and digital marketing development and support, trade advertising, lead generation,
multi-media projects, print literature, direct mail and public relations activities. In addition, our representatives attend trade
shows to introduce new products, grow relationships with existing customers, develop new customer relationships and
generate sales leads for our products and services.
13
Distributors and Customers
We maintain an extensive global network of approximately 600 independent distributors and work with the largest
route operators in the jurisdictions where we operate to deliver our products to our end-customers.
We define an “independent distributor” as an entity that holds inventory of our products and markets and sells those
products to, and services our products for, our end-customers. Our end-customers are businesses and individuals who
ultimately utilize our product, such as laundromats, hotels and restaurants.
We have deeply established and difficult-to-replicate relationships with our distributors that have been built over
decades. Our distribution partners often see us as the vendor of choice due to our focus on quality, insights into customer
needs, the attractive economics of our machines and our support teams staffed with highly trained personnel.
The vast majority of our distribution is conducted through our independent third-party distributors. Approximately
71% of our global revenue is generated through independent third-party distributors that primarily resell to equipment users
and operators in our end markets. Some of those third-party distributors may also operate some of the equipment
themselves in communal laundry and laundromat settings. Because we do not monitor end-use information after selling to
third-party distributors, we cannot further disaggregate revenue from these channels. The remaining approximately 29% of
our global revenue comprises (i) direct sales to communal laundry room operators (representing approximately 9% of
global revenue) and (ii) sales made through our domestic and international sales offices (representing approximately 13%
and 6%, respectively, of our global revenue) which transact either directly or through local and regional distributors and
dealers. Our top ten distributors globally accounted for approximately 30% of our annual revenue in 2025, and no single
distributor accounted for more than 5% of such revenue. Given that no distributor makes up more than 5% of our annual
revenue, we believe that no single end-customer accounts for more than 5% of our annual revenue.
Competition
Our industry is highly fragmented with few global players and many small regional players. We have few large
competitors within the stand-alone commercial laundry equipment industry of the United States and Canada. We believe
that we are the only participant to serve our Vended and OPL markets with a full line of topload washers, washer-
extractors, frontload washers, tumbler dryers and standard dryers in this region.
We also have several large competitors within the international stand-alone commercial laundry equipment industry
who participate in these regions of the world alongside several other local manufacturers.
In the Commercial In-Home end market, our products principally compete against high-priced residential machines
from consumer brands.
Research and Development
Given our scale and focus, we have been able to make significant investments in the development of new technology
and capabilities that accelerate the replacement cycle of our machines. Between 2021 and 2025, we spent over $115 million
on research and development activities. The engineering advancements resulting from this investment have real utility to
our customers through new products, improving performance and accelerating the replacement of existing systems.
This development is delivered by our global engineering organization of approximately 207 laundry experts based
across our three global engineering hubs in the U.S., Czech Republic and Thailand. They work in industry-leading
facilities, which contain approximately 800 testing bays, and operate with ‘24x7’ testing capability across the globe to
minimize time to market for product innovations while maintaining our highest quality standards. In addition, our research
and development efforts also deliver continuous improvement on existing designs, enhance reliability and performance of
our equipment, improve energy efficiency and ensure regulatory compliance of our laundry products. Our team of
engineers and technical leaders continuously collaborate with our sales and marketing leaders, as well as key customers, to
ensure we identify and meet customer needs.
Our U.S. location in Ripon, Wisconsin is an ISO 17025 Certified Laboratory as part of Underwriters Laboratories’
Data Acceptance Program. We believe we are the only manufacturer in the industry to have this ability, allowing us to
significantly reduce time-to-market for innovations that require certifications.
Our digital innovation strategy has transformed our business from traditional equipment manufacturing to a
technology-enabled solutions provider. We have invested significantly in our proprietary cloud-connected platform that
currently links over 200,000 machines globally and serves more than three million users. This platform, marketed under
14
our various brand names including Speed Queen Insights, Huebsch Command and UniMac CORE, allows us to deliver
value-added services that extend beyond hardware.
Our digital research and development approach is highly customer-centric, with cross-functional teams that include
product managers, quality assurance specialists and developers working directly with customers through extensive field
testing. Recent innovations include our QR code-based payment solution that eliminates the need for app installation, AI-
driven operational insights that provide plain-English recommendations to operators and self-healing machine capabilities
that can resolve some common issues without technician intervention. We have strategically expanded our digital
development teams in Thailand to accelerate our global product delivery capabilities while maintaining consistent quality
standards. Looking ahead, our digital innovation roadmap focuses on sustainability solutions, automation technologies and
deeper ecosystem integrations that will continue to differentiate our offerings in the commercial laundry space.
Manufacturing
We operate six strategically located facilities globally and we believe we are the only manufacturer that produces
across North America, Europe and Asia Pacific. This “local for local” strategy delivers supply chain resiliency and
strengthens our cost position. Our manufacturing footprint spans approximately 2.7 million square feet and our facilities
have significant vertical integration, which enables greater control over the manufacturing process.
Country | Facilities | Approx. Sq. Ft. | ||
United States | 3 | 2,000,000 | ||
Czech Republic | 1 | 380,000 | ||
Thailand | 1 | 280,000 | ||
China | 1 | 60,000 |
Our manufacturing operations primarily engage in fabricating, machining, painting, assembling and finishing
operations, but also operate as finished goods and service parts distribution centers. The facilities are organized to focus on
specific product groups although each facility serves multiple end markets and segments.
The U.S. facilities produce our small-chassis topload washers, frontload washers and dryers as well as large-chassis
washer extractors and dryers. The other facilities all produce large-chassis washer extractors and dryers while the Czech
Republic also produces barrier washers and ironers. This diversification of production supports our “local for local”
strategy and enables us to respond quickly to local requirements. This strategy also allowed us to temporarily move
production of some large-chassis equipment between our U.S. and Thai facilities and some small-chassis assembly from
the U.S. to the Czech Republic to maximize available labor during COVID-19 restrictions.
We have invested approximately $371 million in capital expenditures in our manufacturing facilities over the past ten
years, including opening new facilities in the U.S. and Thailand. Current global production is at approximately 84% of
capacity and we believe we have more than sufficient capacity to fulfill our medium-term growth objectives and beyond
while maintaining our approximate 3% of net revenue annual capital expenditure spend target.
We are committed to continuous improvement in all aspects of our business and operations in order to maintain our
industry leading position and all our manufacturing facilities are certified by the International Standardization Organization
(“ISO”).
Country | ISO Certification | |
United States | 9001 | |
Czech Republic | 9001 14001 45001 50001 | |
Thailand | 9001 14001 45001 50001 | |
China | 9001 14001 45001 |
Suppliers and Materials
We purchase substantially all our raw materials and components from a variety of independent suppliers. Where
possible and cost effective we aim to do this as close to each of our manufacturing facilities as possible, sourcing in region
for consumption in the same region.
15
Key material inputs for manufacturing processes include motors, stainless and carbon steel, aluminum castings,
electronic controls, corrugated boxes and plastics. While we believe most of our raw materials and component parts are
generally available from multiple suppliers at competitive prices, due to the nature of some of our purchases, including
some co-developed components, we do have some single- and sole-source suppliers and are exposed to commodity
markets.
Our largest single input material is steel and we aim to secure supply agreements for extended periods of time at fixed
prices to mitigate the risk of market fluctuations. We believe we currently have sufficient steel under contract for the near
term. For further discussion of the possible effects of the cost and availability of raw materials on our business, see the
Employees
As of December 31, 2025, we employed 3,923 full-time employees and 50 part-time employees. Of these employees,
2,730 are located in the United States and 1,243 are located outside of the United States (including 674, 354, 74 and 38
employees in the Czech Republic, Thailand, China and France, respectively). The United Steelworkers union represented
1,691 employees at our Wisconsin facilities. All employees at our Pribor, Czech Republic facility are subject to a collective
bargaining agreement, and certain employees at the facility are represented by a trade union. All employees at our
Guangzhou, China facility are subject to a collective bargaining agreement and represented by a workers’ union. All
employees at our Saint-Priest, France facility are represented by a social and economic committee. We believe that our
current labor relations are good and no labor disruptions are anticipated in the foreseeable future.
In December 2021, the United Steelworkers union ratified a five-year contract with us. The contract became effective
on January 1, 2022 and expires February 28, 2027, and contains provisions that are usual and customary. There have been
no work stoppages at any of our Wisconsin facilities for more than 50 years.
Intellectual Property
We rely upon a combination of trade secrets, copyrights, trademarks, patents, confidentiality policies and procedures,
nondisclosure agreements and technical measures designed to protect the intellectual property and commercially valuable
confidential information and data used in our business. We also develop proprietary software, primarily for our firmware
and digital products. We license our intellectual property to third parties for them to develop vended payment systems that
are compatible with our equipment. We also receive licenses to third-party intellectual property, some of which is
integrated into our products.
We take steps to safeguard our trade secrets and proprietary information. These measures include internal access
controls, nondisclosure agreements with employees and third parties and cybersecurity protocols designed to prevent
unauthorized disclosure of sensitive business information. We also monitor and pursue action against infringements of our
intellectual property, such as trademark rights and trade secrets.
We believe we have taken reasonable measures to protect this portfolio of intellectual property rights, but we cannot be
assured that none of these intellectual property rights may be challenged and found invalid or unenforceable. See the “Risk
Factors” section for further discussion of intellectual property matters.
Regulatory Matters
We are subject to foreign, federal, state and local laws and regulations that impact our business, including the design,
manufacture, marketing, sale, servicing, packaging, labeling, handling, storage, transportation and use of our commercial
and residential laundry equipment. These laws and regulations relate to matters such as product safety and certification,
product labeling, energy and water efficiency standards, environmental protection, workplace health and safety, and ESG
and sustainability. In the United States, our operations are regulated by agencies such as the Consumer Product Safety
Commission, Federal Trade Commission and DOE, as well as the Environmental Protection Agency and the Occupational
Safety and Health Administration. Our international operations are also subject to regulation by equivalent regulatory
agencies and frameworks of the countries in which we operate and sell our products. Violations of such laws and
regulations could result in fines and penalties, enforcement actions, third-party claims, cessation of operations and other
sanctions. In addition, compliance with such laws and regulations in the future could prove to be costly and could affect
various aspects of our business.
We and our operations are also subject to and affected by foreign, federal, state and local EHS regulations, including
with respect to climate concerns. In particular, our business is subject to governmental regulation of energy and water
usage and efficiency standards, emissions of air pollutants, including greenhouse gas emissions, discharges of wastewater
16
and stormwater, releases of hazardous materials to soil and water, the transportation, treatment, storage and disposal of
hazardous wastes and exposure to hazardous materials in current or former products, the workplace or the environment,
among other things. See “Item 1A. Risk Factors—Risks Relating to Government Regulation and Litigation—We could
incur significant costs in complying with EHS laws and regulations and could be adversely affected by liabilities or
obligations imposed under such laws.” and “Risk Factors—Risks Relating to Government Regulation and Litigation—
Energy efficiency, water usage standards and other product-related standards could adversely affect our industry.”
Changes in laws and regulations or government policies could affect our operations worldwide. Additionally, the
evolving and increased fragmentation of regulatory requirements may increase our costs by requiring the development of
country-specific variants, the monitoring and compliance of additional regulations as well as additional testing and
certifications. The laws, regulations and policies applicable to our products and services change regularly, and certain
regulatory changes may render our products and technologies noncompliant. In addition, we are also subject to evolving
standards and requirements related to ESG and sustainability matters. For example, the CSRD enacted in the European
Union and certain laws enacted in California will require us to report on various sustainability-related information,
including greenhouse gas emissions. See“Risk Factors—Risks Relating to Government Regulation and Litigation—We are
subject to risks related to environmental, social and governance (“ESG”) and sustainability laws, regulations, policies and
initiatives.”
Our operations are also subject to and could be affected by the changing landscape related to tariffs and trade
regulations. U.S. laws, regulations, orders and other measures concerning the export or re-export of products, software,
services and technology, and other trade-related activities involving non-U.S. countries and parties affect the operations of
our company and our affiliates. These potential effects are further discussed in “Risk Factors—Risks Relating to
Government Regulation and Litigation—Our international operations expose us to worldwide economic conditions;
unfavorable global economic conditions could lead to reduced revenues and negatively impact our results of operations.”
For further discussion of risks related to other government regulations, see “Item 1A. Risk Factors—Risks Relating to
Government Regulation and Litigation.”
Available Information
The Company's website is www.alliancelaundry.com. Our annual reports on Form 10-K, quarterly reports on Form 10-
Q, current reports on Form 8-k and amendments to those reports (if applicable) are available free of charge through the
"Investors" link as soon as reasonably practicable after they are filed with the Securities and Exchange Commission (SEC).
We have also posted on our website our Code of Business Conduct and Ethics, which govern our officers, directors,
employees and contractors. All reports we file with the SEC are also available free of charge via EDGAR through the
SEC's website at https://www.sec.gov. The information on these websites is not part of this report and is therefore not
incorporated herein by reference.
17
Item 1A. Risk Factors
An investment in our common stock involves risks. Before making an investment decision, you should carefully
consider the following risks and uncertainties, together with the other information contained in this Annual Report. The
risks and uncertainties described below are not the only ones we face. If any of these risks actually occur, our business,
prospects, operating results or financial condition could suffer materially, the trading price of our common stock could
decline and you could lose all or part of your investment. These disclosures reflect the Company’s beliefs and opinions as
to factors that could materially and adversely affect the Company and its securities in the future. References to past events
are provided by way of example only and are not intended to be a complete listing or a representation as to whether or not
such factors have occurred in the past or their likelihood of occurring in the future.
Some statements in this Annual Report, including statements in the following risk factors, constitute forward-looking
statements. See the section titled “Cautionary Note Regarding Forward-Looking Statements.”
Risks Relating to Our Business
We design, manufacture and service products that incorporate innovative technologies. The introduction of new
products and technologies involves risks, and we may not realize the degree or timing of benefits initially anticipated.
Our future success depends on designing, developing, producing, selling and supporting innovative products with
innovative technologies and anticipating industry changes. The regulations and policies applicable to our products, as well
as our customers’ product and service needs, change from time to time. Moreover, regulatory and policy changes, including
those relating to energy infrastructure, consumption and efficiency, as well as other events and their impacts, may render
our products and technologies non-compliant or non-competitive and may subject us to operational, compliance, business
and reputational risks and increased costs. See “Item 1A. Risk Factors - Risks Relating to Government Regulation and
Litigation-Energy efficiency, water usage standards and other product-related standards could adversely affect our
industry.” Our ability to realize the anticipated benefits of our technological advancements or product improvements-
including those associated with regulatory or policy changes-depends on a variety of factors, including: meeting
development, production and regulatory approval schedules; meeting performance plans and expectations; the availability
of raw materials and parts; our suppliers’ performance; our distributors’ performance; the hiring, training and deployment
of qualified personnel; achieving efficiencies; identifying emerging regulatory and technological trends; validating
innovative technologies; the level of customer interest in new technologies and products; and the costs and customer
acceptance of our new or improved products.
Our research and development efforts, including those aimed at advancing the environmental sustainability of our
products, such as reducing product water and energy consumption, may not culminate in new technologies or timely
products, or may not meet the needs or expectations of our customers as effectively as competitive offerings. Our
competitors may develop competing technologies that gain market acceptance before or instead of our products. In
addition, we may not be successful in anticipating or reacting to changes in the regulatory environments in which our
products are sold, and the markets for our products may not develop or grow as we anticipate.
Additionally, our products and services also may incorporate technologies developed or manufactured by third parties,
which, when combined with our technology or products, creates additional risks and uncertainties. As a result, the
performance and market acceptance of these third-party products and services could affect the level of customer interest
and acceptance of our own products in the marketplace.
We operate in a competitive market.
We have several large competitors within the markets in which we operate. There can be no assurance that significant
new competitors or increased competition from existing competitors will not have a material adverse effect on our
business, financial condition, results of operations and cash flows. There can be no assurance that we will not encounter
increased competition in the future, which could have a material adverse effect on our business, financial condition, results
of operations and cash flows.
In addition, we may face competition from companies outside of the U.S. that may have lower costs of production
(including labor or raw materials). These companies may pass along these lower production costs to customers, resulting in
a lower price for products like ours. As a result, our revenues and profits could be adversely affected. Certain of our
competitors have more experience than we do in the international markets we compete in. As a result, certain of our
competitors may have preexisting relationships with customers and may have obtained regulatory approvals in foreign
jurisdictions, which may negatively affect our ability to compete successfully in these international markets.
18
Our business depends on the performance of our third-party distributors, route operators and suppliers who are subject
to additional risks that are beyond our control, including those that could harm our business, financial condition and
results of operations.
We utilize third-party distributors to sell our products into international end-markets and route operators with global
delivery systems in order to manage the delivery of our products to such distributors. We rely on approximately 600
distributors worldwide who provide services from design and installation to aftermarket. Additionally, though our strategy
generally involves sourcing inputs from the same or nearby geographic regions as our manufacturing facilities, we continue
to face risks associated with supply disruptions or delays in shipments and supply chains regionally and globally. As a
result of our international operations, we are subject to risks associated with doing business in multiple jurisdictions,
including retailer and consumer boycotts due to actual or perceived ethical, environmental, social or political issues in
certain countries in which we do business and where our products are distributed, including reputational harm related to
substantiated or unsubstantiated human rights and labor concerns; the need to navigate and difficulty ensuring compliance
with existing and new laws and regulations in many jurisdictions, including those relating to labor conditions and
workplace safety, environmental protection, chemical regulations, water and energy usage, quality and safety standards,
imports, duties, taxes and other changes on imports; reduced protection for intellectual property rights in some countries;
disruptions or delays in shipments and supply chains globally; and changes in local economic conditions where
distributors, suppliers, route operators, retailers and customers are located. If our internal controls and compliance
programs do not adequately monitor, deter or prevent our employees as well as our distributors, route operators, suppliers
and other third parties with whom we do business from violating anti-bribery, anti-corruption or trade laws and regulations,
we may incur defense costs, fines, penalties, reputational harm, business disruptions and damage to our business.
In particular, compliance with sanctions and customs trade orders could affect the sourcing and availability of raw
materials used by our suppliers in the manufacturing of certain of our products. Our ability to successfully import such
materials may be adversely affected by changes in laws across jurisdictions. There are also increasing requirements and
expectations in various jurisdictions that companies proactively monitor the environmental and social performance of their
value chain, including compliance with a variety of labor practices and human rights considerations, as well as
consideration of a wider range of environmental and social matters, including the end-of-life considerations for products.
For example, various jurisdictions have adopted, or are considering adopting, regulations that would require organizations
to, among other things, conduct due diligence to identify certain environmental and human rights risks in their supply
chains and take steps to mitigate any such risks identified. We have been and may continue to be subject to costs associated
with such regulations, as well as any future regulations on the source of products or their component parts or materials,
including for the diligence pertaining to these matters and the cost of remediation and other changes to products, processes
or sources of supply as a consequence of such verification activities. The impact of such regulations may result in a limited
pool of acceptable suppliers, and we cannot guarantee that we will be able to obtain products in sufficient quantities at
competitive prices and of similar quality. Additionally, because our supply chain is complex, we may face regulatory
challenges in complying with applicable sanctions and trade regulations and reputational challenges with our consumers
and other stakeholders if we are unable to sufficiently verify the origins of the materials used in the products we sell. See
“Item 1A. Risk Factors - Risks Relating to Our Business—Tariffs and other trade restrictions could adversely affect our
business and financial results, and we may not be able to raise prices sufficiently to offset increased costs caused by any
such tariffs” for more information on tariff-related risks. Even if we comply with applicable regulations, we may be subject
to additional expectations and scrutiny from investors, business partners, wholesale partners, consumers or other
stakeholders on our environmental and human rights practices. These expectations are evolving quickly, and, as a result,
certain of our actions or decisions, either currently or in the future, may be perceived to not align with best practices or as
otherwise inconsistent with stakeholder expectations, which could damage our reputation and adversely impact our
business. See “Item 1A. Risk Factors - Risks Relating to Government Regulation and Litigation—We are subject to risks
related to environmental, social and governance (“ESG”) and sustainability laws, regulations, policies and initiatives.”
Further, if any distributors, route operators, suppliers, retailers or servicers are unable or unwilling to perform
according to the negotiated terms and timetable of its respective agreement for any reason or if any terminates its
agreement, we would be required to engage a substitute distributor, supplier, retailer or servicer. This would likely result in
significant project delays and increased costs, which could have a material adverse effect on our business, financial
condition, results of operations and cash flows.
We do not have long-term purchase commitments from our distributors, suppliers and retailers and may have to rely on
distributor, supplier and retailer forecast in making production decisions, and any cancellation of purchase
commitments or orders may result in the waste of raw materials or work in process associated with those orders,
reducing both our revenues and profitability.
A variety of conditions, both specific to our distributors and generally affecting the demand for these products, may
cause our distributors to cancel, reduce or delay orders. Cancellations, reductions or delays by a significant distributor or a
19
number of distributors would result in a material reduction in our revenue. Those distributor decisions could also result in
excess and obsolete inventory or unabsorbed manufacturing capacity, which could reduce our profits or impair our cash
flow. On occasion, distributors require rapid increases in production, which could strain our resources, leading to a
potential reduction in our margins because of the additional costs necessary to meet those demands.
Our distributors generally do not make firm, long-term volume purchase commitments. In addition, industry trends
over the past five years have led to dramatically shortened lead times on purchase orders, as rapid product cycles have
become the norm. Although we sometimes enter manufacturing contracts with our customers, these contracts principally
clarify order lead times, inventory risk allocation and similar matters, rather than providing for firm, long-term
commitments to purchase a specified volume of products at a fixed price. As a result, distributors can generally cancel
purchase commitments or reduce or delay orders at any time. The large percentage of our sales to distributors in the
industry, which is subject to severe competitive pressure, rapid technological change and product obsolescence, increases
our inventory and overhead risks, among others, as we must maintain inventories of raw materials, work in process and
finished goods to meet customer delivery requirements, and those inventories may become obsolete if the anticipated
market demand does not materialize. Additionally, there has been consolidation of distributors in our industry. Increased
consolidation may result in fewer alternatives for distributors, which in turn could decrease our bargaining power as it
relates to pricing and purchase order terms.
We also make significant decisions, including determining the levels of business that we will seek and accept,
production schedules, component and raw material procurement commitments, facility requirements, personnel need, and
other resource requirements, based upon our estimates of distributor requirements. The short-term nature of our
distributors’ commitments and the possibility of rapid changes in demand for these products reduce our ability to estimate
accurately their future requirements. Because many of our costs and operating expenses are fixed, a reduction in customer
demand can reduce our gross margins and operating results. To transact business, we assess the integrity and
creditworthiness of our distributors and suppliers and we may, based on this assessment, incur design and development
costs that we expect to recoup over several orders produced for the customer. Such assessments are not always accurate and
expose us to potential costs, including the write off costs incurred and inventory obsolescence if the orders anticipated do
not materialize. We may also occasionally place orders with suppliers based on a customer’s forecast or in anticipation of
an order that is not realized. Additionally, from time to time, we may purchase quantities of supplies and materials greater
than required by customer orders to secure more favorable pricing, delivery or credit terms. These purchases can expose us
to losses from cancellation costs, inventory carrying costs or inventory obsolescence, and hence adversely affect our
business and operating results.
Our business depends on our customers and their continued engagement with us.
Our business depends upon the financial viability of our customers and the preservation of our relationships with them.
Some of our sales arrangements with these customers are by purchase order and are terminable at will at the option of
either party, rather than long-term contracts. For customers with long-term contracts, these customers have no obligation to
renew their contracts after their initial contract is satisfied, and in the normal course of business, some customers will elect
not to pursue additional contracts for our products. Any material cancellation, reduction or delay in purchases by these
customers could have a material adverse effect on our business, financial condition, results of operations and cash flows.
Additionally, certain of our contractual arrangements with customers limit our ability to raise our prices during the term of
the contract. These limitations may restrict our ability to respond to inflationary pressures, resulting in a negative impact to
our business, financial condition, results of operations and cash flows.
Moreover, our continued success depends in part on our ability to sell additional products, updated products replacing
pre-existing products or enhancements to pre-existing products to our current customers. This may require increasingly
sophisticated and costly sales efforts. Similarly, the rate at which our customers purchase new products depends on a
number of factors, including general economic conditions and customer receptiveness to any price changes related to these
additional features and services.
Price fluctuations or shortages of raw materials could adversely affect our operations.
The major raw materials and components we purchase for our production process are carbon and stainless steel,
motors, aluminum castings, electronic controls, corrugated boxes and plastics. The price and availability of these raw
materials and components are subject to market conditions affecting supply. Many of the commodities that affect our raw
material and component costs have fluctuated significantly over the past several years, due to supply and demand trends,
government regulations and tariffs, currency exchange rates, transportation costs and global economic factors. We take
steps to contain such cost fluctuations by using hedge instruments or contracts, implementing price increases, increasing
our inventory or entering into fixed-price contracts. However, there can be no assurance that any such mitigation efforts,
20
including holding excess inventory, will be effective, or that any such price increases would not negatively impact
customer demand, such that increases in raw material or component costs (to the extent we are unable to pass on such
higher costs to customers) will not have a material adverse effect on our business, financial condition, results of operations
and cash flows.
We purchase a portion of these raw materials and component parts from foreign suppliers using foreign currency, and
as a result, we are subject to exchange rate fluctuations. Complex global political and economic dynamics can affect
exchange rate fluctuations. For example, the implementation of tariffs, quotas, duties or other measures related to the level
of trade between the United States and other markets could impact the value of the U.S. dollar. It is difficult to predict
future fluctuations and the effect these fluctuations may have on our business, financial condition, results of operations and
cash flows. Our reliance on suppliers to secure the raw materials and components used in our products, and on service
providers to deliver our products, also exposes us to volatility in the prices and availability of these services. Because we
maintain limited raw material and component inventories, even brief unanticipated delays in delivery by suppliers,
including those due to capacity constraints, labor disputes, impaired financial condition of suppliers, weather emergencies
or natural or man-made disasters, may impair our ability to satisfy our customers’ needs and could adversely affect our
business and financial performance.
We face inventory risk caused by inherent uncertainty in inventory forecasting and production planning.
We are exposed to inventory risks that may adversely affect our operating results as a result of new product launches,
changes in product pricing, defective products and associated product liability and changes in consumer demand and
spending patterns. We endeavor to accurately predict these changes and avoid overstocking or understocking products we
manufacture or sell. Demand for products, however, can change significantly between the time we order major raw
materials and components we purchase for our production process and the date of sale of our resulting inventory. In
addition, when we begin selling or manufacturing a new product, it may be difficult to establish third-party distributor
relationships for sale of such new product, determine appropriate product or component selection, or accurately forecast
demand. The acquisition of raw materials and components we purchase for our production process requires significant
lead-time and prepayment, and they may not be returnable. We carry a broad selection and significant inventory levels of
certain products, and at times we are unable to sell products in sufficient quantities or meet consumer demand. If our
inventory forecasting and production planning processes result in higher inventory levels exceeding the levels demanded
by customers or should our customers decrease their orders with us, our operating results could be adversely affected due
to costs of carrying the inventory and additional inventory write-downs for excess and obsolete inventory.
We depend on suppliers, including single-source suppliers and, in certain cases, sole-source suppliers, to consistently
supply us with components for our products, and any failure to procure such components could have a material adverse
effect on our product inventories, sales, operating results and cash flows.
We rely on single-source suppliers for certain proprietary component parts in our products. A single-source supplier is
a supplier from which we make all purchases of a particular component used in our products even though other suppliers of
the component exist. A sole-source supplier is a supplier from which we make all purchases of a particular component used
in our product, and the supplier is the only source of that particular component in the market. If these single-source or sole-
source suppliers were to cease or interrupt production or otherwise fail to supply these components to us, we would be
unable to obtain these proprietary component parts for an indeterminate period of time, which could adversely affect our
product inventories, sales, operating results and cash flows. These single-source and sole-source suppliers also expose us to
pricing risk.
Establishing additional or replacement suppliers for any of these materials or components, if required, could limit our
ability to manufacture our products, result in production delays and increased costs and adversely affect our ability to
deliver products to our customers on a timely basis or at all. Delays related to supplier changes could also arise due to
increased shipping times if new suppliers are located farther away from our markets or from other participants in our
supply chain. In addition, freight capacity issues continue to persist worldwide as there is much greater demand for
shipping and reduced capacity and equipment. If we are not able to identify alternate sources of supply for the components,
we might need to modify our product to use substitute components, which could cause delays in shipments, increase design
and manufacturing costs and increase prices for our products. Any such modified product might not be as effective as the
predecessor product or might not gain market acceptance. This could lead to customer or consumer dissatisfaction and
damage to our reputation and could materially and adversely affect our product inventories, sales, operating results and
cash flows.
Operations at any of our suppliers’ facilities are subject to disruption for a variety of reasons, including, but not limited
to, work stoppages, labor relations, intellectual property claims against suppliers, information technology failures,
21
cybersecurity incidents, data breaches and hazards such as fire, earthquakes, flooding or other natural or man-made
disasters. Such disruptions could interrupt our ability to manufacture certain products, which could negatively impact our
revenue and earnings performance. It may be difficult or impossible for us to obtain insurance to protect against any such
disruptions at an adequate coverage level or at all.
Global economic downturns could negatively impact our suppliers and customers.
Our suppliers and customers are subject to some of the same risks regarding worldwide economic conditions, and
therefore could be negatively affected by global economic downturns. Such downturns may tighten credit markets and
lower liquidity levels and there can be no assurance that conditions will improve. Lower credit availability may increase
borrowing costs for our customers and suppliers. In addition, some of our customers and suppliers may experience
financial problems due to reduced access to credit and lower revenues. Financial duress may prompt some of our suppliers
to seek to renegotiate supply terms with us, eliminate or reduce production of certain components we purchase or file for
bankruptcy protection. In addition, some of our customers may be unable to obtain financing to purchase products or meet
their payment obligations to us. Further, negative economic conditions could result in the insolvency of one or more of our
customers or suppliers.
Failure to achieve and maintain a high level of product and service quality could damage our reputation with
customers, increase our costs or otherwise negatively impact our results and market share.
Product and service quality issues could harm customer confidence in our products, company and our brands. If certain
of our product and service offerings do not meet applicable safety standards or our customers’ expectations regarding
safety or quality, or if we fail to obtain or maintain applicable product safety certifications, we can experience lost sales or
increased costs and we can be exposed to legal, financial and reputational risks, including due to poor reviews on consumer
review platforms and through social media. Our ability to satisfy customer expectations and respond to any negative
feedback quickly and effectively may impact our results. Actual, potential or perceived product safety concerns could also
expose us to litigation as well as government enforcement actions. In addition, when our products fail to perform as
expected, we may be exposed to warranty, product liability, personal injury and other claims in the future.
While we maintain strict quality controls and procedures, we cannot be certain that these controls and procedures will
reveal defects in our products or their raw materials, which may not become apparent until after the products have been
placed in use in the market. Accordingly, there is a risk that products will have defects, which could require a product recall
or field corrective action. Product recalls and field corrective actions can be expensive to implement and may damage our
reputation, customer relationships and market share.
We provide our customers a warranty covering workmanship and, in some cases, materials in products we
manufacture, and we have in the past faced, and may in the future face, potential warranty or safety breaches in products
we manufacture. Certain of our product warranties also include coverage for the labor cost of the servicing company. If a
product fails to comply with the warranty, we may be obligated, at our expense, to correct any defect by repairing or
replacing the defective component, and we have in the past been, and may in the future be, required to incur such expense
to resolve warranty or safety claims. We maintain warranty reserves in an amount based primarily on the number of units
shipped and on historical and anticipated warranty claims. However, there can be no assurance that future warranty claims
will follow historical patterns or that we can accurately anticipate the level of future warranty claims. An increase in the
rate of warranty claims or the occurrence of unexpected warranty claims could materially and adversely affect our business,
financial condition, results of operations and cash flows.
In many jurisdictions, product liability claims are not limited to any specified amount of recovery. Personal injury or
property damage lawsuits resulting from product liability risks may involve individual and purported class actions. We
cannot be sure that our existing insurance or any additional insurance will provide adequate coverage against potential
liabilities and any such liabilities could adversely affect our business, financial condition, results of operations and cash
flows. In addition to direct expenditures for damages, settlements and defense costs, there is also a possibility of adverse
publicity as a result of product liability claims.
A recall or claim could require us to review our entire product portfolio to assess whether similar issues are present in
other products, which could result in a significant disruption to our business and which could have a further adverse impact
on our business, financial condition, results of operations and cash flows. There can be no assurance that we will not
experience any material warranty or product liability claims in the future, that we will not incur significant costs to defend
such claims or that we will have adequate reserves or insurance to cover any recall, repair and replacement costs.
22
Product installation also frequently depends on third-party distributors or other service providers. Our inability to find
qualified technicians to perform these installation services, or any of these service providers damaging or failing to
properly install any of our products, could also expose us to warranty, product liability, personal injury or other claims in
the future. Moreover, as customers often see these downstream service providers as an extension of the Alliance business
despite their independence as third parties, any such issues could damage our reputation, customer relationships and market
share.
Our financing programs to end-customers expose us to additional risks which could adversely affect our operations.
We offer an extensive financing program to end-customers, primarily laundromat owners, to assist them in their
purchases of new equipment from our distributors or, in the case of route operators, from us. Typical terms for equipment
financing receivables range from two to twelve years. As of December 31, 2025, the average principal loan balance is
approximately $0.1 million. We fund these financing programs through our $530.0 million Asset Backed Equipment
Facility. In the case of a rapid amortization event or an event of default under our Asset Backed Equipment Facility, we
will not be permitted to request new borrowings thereunder. In this case, or if certain limits in the size of our Asset Backed
Equipment Facility are reached (either overall size or certain sublimits) or upon termination of our Asset Backed
Equipment Facility, we would be required to obtain additional funding to support our customer financing program. Our
inability to obtain such additional funding or our inability to securitize our equipment financing pursuant to the Asset
Backed Equipment Facility could limit our ability to provide our end-customers with financing, which could result in the
loss of sales and have a material adverse effect on our business, financial condition, results of operations and cash flows.
See “Part II, Item 7. Management’s Discussion and Analysis of Financial Condition and Results of Operations,” in this
Annual Report for further information regarding our Asset Backed Equipment Facility.
Our financing program also subjects us to additional regulatory requirements and compliance obligations. In particular,
the program requires that the Company be licensed as a lender in certain jurisdictions in which the Company operates. The
Company has been subject to, and in the future may be subject to, potential supervision, examinations or enforcement
actions by federal and state licensing and regulatory agencies or penalties for violations of financial services, consumer
protections and other applicable laws and regulations. If any proceedings or investigations are determined adversely to us
or result in legal actions, claims, regulatory proceedings, enforcement actions, or judgments, fines or settlements involving
a payment of material amounts, or if injunctive relief is issued against us, our business, financial condition, results of
operations and cash flows could be materially adversely affected.
We are subject to risks associated with our Asset Backed Trade Receivables Facility.
We may finance a portion of our working capital through our Asset Backed Trade Receivables Facility administered
by our special-purpose, bankruptcy-remote subsidiary, Alliance Laundry Trade Receivables LLC. Under this facility, we
sell newly originated trade receivables to the subsidiary, which in turn borrows against those receivables. The facility limit
is $120.0 million and the revolving period currently extends to May 1, 2028, after which no new borrowings may be
requested and outstanding balances are scheduled to amortize over 180 days, with any remaining amount due at maturity.
Borrowings bear interest at a floating rate equal to the daily 1-month SOFR plus 110 basis points, which was 4.8% as of
December 31, 2025 and we pay an unused commitment fee of 0.35% on unfunded commitments.
Our borrowing capacity is dependent on the size and performance of the eligible receivables pool and our compliance
with facility covenants and performance triggers. Sales slowdowns, increased customer delinquencies or dilutions, changes
in eligibility or concentration limits, or servicing issues could reduce availability, increase borrowing costs, or otherwise
limit our access to receivable collections. We may be unable to renew, refinance, or replace the facility on acceptable terms
before the end of the revolving period. We also face risk that the facility’s lenders will default on its obligations and are
exposed to changes in interest rates. Although we consolidate the subsidiary and its assets and liabilities in our financial
statements, the receivables and related collections are pledged to facility lenders and subject to control provisions; as a
result, adverse developments under the facility could restrict access to collections and negatively affect our liquidity, results
of operations, and financial condition. See Note 6 - Asset Backed Facilities to our consolidated financial statements in this
Annual Report for further information regarding our Asset Backed Trade Receivables Facility.
Past growth may not be indicative of future growth.
Historically, we have experienced substantial sales growth through organic market share gains, geographic expansion,
technological innovation, new product offerings, increased demand and acquisitions that have increased our size, scope and
geographic footprint. However, our various business strategies and initiatives, including our growth initiatives, are subject
to business, economic, regulatory and competitive uncertainties and contingencies, many of which are beyond our control.
For example, delays in laundromat construction or increased permitting requirements may adversely impact our ability to
expand our business. In certain prior periods, our results in a particular period have been impacted by unanticipated delays
23
in construction. If we are not able to continue to compete in our markets, expand into new markets and grow our existing
business, our business, financial condition, results of operations and cash flows could be adversely affected.
We may encounter certain risks and incur certain expenses when implementing our business strategy to continue to
grow our international business, particularly in emerging markets.
The continued execution of our strategy to grow our international business could cause us to incur unforeseen capital
expenditures or significant start-up expenses related to growth initiatives and cause us to incur losses on assets devoted to
the strategy. In addition, expansion of international marketing and advertising efforts could lead to a significant increase in
our marketing and advertising expenses and could increase our customer acquisition costs. Furthermore, certain
international markets may not be receptive to our products and services or we may face increased competition from lower
cost manufacturers. Any failure to continue to successfully execute this strategy could adversely affect our business,
financial condition, results of operations and cash flows.
Further, we expect that sales to emerging markets will continue to account for a meaningful portion of our sales as
developing nations and regions around the world increase their demand for our products. Emerging markets are subject to
different risks as compared to more developed markets, and operating a business in an emerging market can involve a
greater degree of risk than operating a business in more developed markets, including, in some cases, increased political,
economic and legal risks. There is no guarantee that future political or economic instability will not occur in countries in
which we operate, and the risks we may face with respect to these countries include the risk of unforeseen government
actions, acts of god, terrorism, hostage taking, military repression, extreme fluctuations in currency exchange rates, high
rates of inflation, labor unrest, war or civil unrest, expropriation and nationalization, renegotiation or nullification of
existing concessions, licenses, permits and contracts, changes in taxation policies, and restrictions on foreign exchange and
repatriation, as well as changing political conditions, currency controls, export controls and governmental regulations that
favor or require the awarding of contracts to local contractors or require foreign contractors to employ citizens of, or
purchase supplies from, a particular jurisdiction or other events. Moreover, emerging market governments and judiciaries
often exercise broad, unchecked discretion and are susceptible to abuse and corruption. Additionally, financial turmoil in
any emerging market country tends to adversely affect the value of investments in all emerging market countries as
investors move their money to more stable, developed markets. Financial problems or an increase in the perceived risks
associated with investing in companies in emerging economies could dampen foreign investment and adversely affect local
economies in which we operate. While these factors and their impact are difficult to predict, any one or more of them could
have a material adverse effect on our competitive position, results of operations, cash flows or financial condition.
We are exposed to the risk of foreign currency fluctuations.
Because a portion of our revenue is attributable to the sale of our products outside of the United States, we are exposed
to adverse as well as beneficial movements in exchange rates between the U.S. dollar and the relevant foreign currency.
Moreover, some of our operations are or will be conducted by subsidiaries organized in foreign countries. The results of
operations and financial position of these subsidiaries will be reported in the relevant foreign currencies and then translated
into U.S. dollars at the applicable exchange rates for inclusion in our consolidated financial statements, which are stated in
U.S. dollars. In addition, our balance sheet reflects non-U.S. dollar denominated assets and liabilities, including
intercompany balances eliminated in consolidation. Accordingly, fluctuations in exchange rates may give rise to gains or
losses when financial statements of non-U.S. operating subsidiaries are translated into U.S. dollars. The exchange rates
between many of these currencies, including the euro, Czech koruna, Thai baht and U.S. dollar, have fluctuated
significantly in recent years and may fluctuate significantly in the future. Such fluctuations may have a material adverse
effect on our results of operations and financial position and may significantly affect the comparability of our results
between financial periods.
Additionally, currency fluctuations may affect the prices we pay for the materials used in our products, and as a result,
our operating margins may be negatively impacted by higher costs for certain cross border transactions.
We also incur currency transaction risk whenever one of our operating subsidiaries enters into a transaction using a
different currency than its functional currency. While we attempt to reduce currency transaction risk by matching cash
flows and payments in the same currency and entering into foreign exchange contracts for hedging purposes, we cannot
provide assurance that we will be successful in reducing or hedging our exposure.
Our international operations expose us to worldwide economic conditions; unfavorable global economic conditions
could lead to reduced revenues and negatively impact our results of operations.
We compete in various geographic regions and markets around the world and increasingly manufacture and sell our
products outside of the United States. For the year ended December 31, 2025, approximately 26% of our net revenue was
24
attributable to products sold outside of the United States. Beyond our locations in the U.S., we have manufacturing
facilities located in the Czech Republic, Thailand and China, and sales offices in nine different countries. We also export
our products to other foreign countries, and expanding international sales is part of our growth strategy.
International operations generally are subject to various risks, including political, military, religious and economic
instability, local labor market conditions, the imposition of tariffs, the impact of government regulations, foreign national
priorities, government budgets, the effects of income and withholding tax, foreign exchange controls, repatriation of
earnings, investments, governmental expropriation and differences in business practices. We may incur increased costs and
experience delays or disruptions in product deliveries and receipt of payments in connection with international
manufacturing and sales that could result in a loss of revenue. Unfavorable changes in the political, regulatory and business
climate of various foreign jurisdictions in which we operate could have a material adverse effect on our business, financial
condition, results of operations and cash flows. Additionally, government policies on international trade and investments
such as import quotas, capital controls, taxes or tariffs or similar trade barriers, whether imposed by individual
governments or regional trade blocs, can affect demand for our products and services, impact the competitive position of
our products or services or encumber our ability to manufacture or sell products in certain countries.
In addition, we may also be affected by broader macroeconomic trends. We have experienced, and expect to continue
to experience, fluctuations in sales and results of operations due to economic and business cycles. Several economic
factors, including, but not limited to, gross domestic product, availability of consumer credit, interest rates, consumer
sentiment and debt levels, fiscal and credit market uncertainty and foreign currency exchange rates, generally affect
demand for our products. Higher unemployment rates, higher fuel and other energy costs, higher deficit spending and debt
levels and higher tax rates adversely affect demand. A decline in economic activity and conditions in the markets in which
we operate has had an adverse effect on our financial condition and results of operations in recent years, and future declines
and adverse conditions could have a similar adverse effect.
The occurrence or continuation of any or all of these events could have a material adverse effect on our business,
financial condition, results of operations and cash flows.
Our business, financial condition and results of operations could be adversely affected by ongoing international
conflicts and related disruptions in the global economy.
The global economy has been negatively impacted by the military conflict between Russia and Ukraine, the ongoing
conflict between Israel and Hamas, and the US-Israel-Iran conflict has caused political, economic and military instability in
Israel and surrounding regions. Our business may indirectly be adversely affected by these conflicts and their respective
effects, including as a result of financial and economic sanctions imposed by governments in the U.S., United Kingdom
and European Union, among others, on certain industry sectors and parties in Russia.
We are unable to predict the impact of either the Russia-Ukraine conflict or the Israel-Hamas conflict on our business
or the global economy. The impact of further escalation of geopolitical tensions related to these conflicts or other
unforeseen conflicts, including increased trade barriers or restrictions on global trade, is unknown and could result in
heightened cybersecurity threats, protracted or further increased inflation, lower consumer demand, fluctuations in interest
and foreign exchange rates and increased volatility in financial markets, among other things, any of which could adversely
affect our business, financial condition, results of operations and cash flows.
The costs and difficulties of acquiring and integrating complementary businesses and technologies could impede our
future growth, diminish our competitiveness and harm our operations.
As part of our growth strategy, from time to time we consider selective acquisitions of complementary businesses. We
might not be able to identify suitable acquisition candidates or business relationships, negotiate acceptable terms for such
acquisitions or relationships or obtain necessary financing on acceptable terms for such acquisitions or relationships. Even
if we consummate acquisitions, such acquisitions could be dilutive to earnings. Moreover, the margins for these companies
might differ from our historical gross and operating margins, resulting in a material adverse effect on our results of
operations.
Additionally, we are responsible for liabilities associated with businesses that we acquire to the extent we are not
entitled to receive indemnification from the relevant sellers or coverage under our insurance policies. Our due diligence
reviews may not identify all of the material issues necessary to accurately estimate the cost and potential loss contingencies
of a particular transaction.
Acquisitions also involve numerous other risks, including:
25
•problems implementing adequate financial reporting and disclosure controls and procedures for the newly
acquired business;
•the challenges in achieving strategic objectives, cost savings and other anticipated benefits;
•unanticipated liabilities, costs or expenses, including post-closing impairment charges as well as expenses
associated with eliminating duplicate facilities;
•difficulties in integrating acquired businesses with our operations, including with respect to technological
integration, applying our internal controls to these acquired businesses, or in managing strategic investments;
•diversion of management’s attention and other resources;
•failure to retain existing, key personnel of the acquired business; and
•the ability to obtain the financing necessary to complete acquisitions on attractive terms, or at all.
Our ability to attract, develop and retain key executives and other qualified employees is crucial to our results of
operations and future growth.
We are dependent on the continued services and performance of our senior management team and certain other key
employees. An inability to hire, develop, engage and retain a sufficient number of qualified employees or to effectively
manage succession planning could materially hinder our business, which could have a material adverse effect on our
business, financial condition, results of operations and cash flows. We do not currently maintain life insurance policies with
respect to key employees.
Additionally, we are dependent on a labor force with technical and manufacturing industry experience to operate our
businesses successfully. From time to time there may be shortages of skilled labor which may make it more difficult or
more expensive for us to attract and retain qualified employees. An inability to attract and retain qualified individuals or
increases in our costs to do so could have a material adverse effect on our business, financial condition, results of
operations and cash flows.
Adverse relations with employees could harm our business.
As of December 31, 2025, 1,691 of our employees at our Wisconsin facilities are represented by the United
Steelworkers union and subject to a collective bargaining agreement, all of our employees at our Guangzhou, China facility
are represented by a workers’ union and subject to a collective bargaining agreement, and all of our employees at our
facility in Pribor, Czech Republic are subject to a collective bargaining agreement, with certain of those employees
represented by a worker’s union. The Wisconsin collective bargaining agreement requires certain minimum full-time
hourly employment levels, unless deviations from those levels are caused by specified events, such as sales fluctuations or
events beyond our reasonable control. However, there can be no assurance that we can successfully maintain such
employment levels at our Wisconsin facilities. In many cases, before we take significant actions with respect to these
production facilities, such as workforce reductions or closures, we must reach agreement with the relevant union or
employee works council, which may result in operational inefficiencies or impede our ability to carry out our cost
reduction efforts. Additionally, these agreements have historically been renewed for two to five year terms, and are
therefore subject to periodic renegotiation, and the terms of future agreements may impose additional costs and operating
inefficiencies on our business. The current union agreement with the United Steelworkers expires February 28, 2027.
Although we have not experienced any recent labor disruptions, strikes or other forms of labor unrest in connection
with our personnel, there can be no assurance that labor disruptions by employees will not occur in the future. Such activity
could result in the incurrence of additional costs, as well as limitations on our ability to operate or provide products and
services to our customers, which may materially affect our business, financial condition, results of operations and cash
flows.
In addition, the transportation and delivery of raw materials to our manufacturing facilities and of our products to our
customers by workers employed by third parties that are members of labor unions is critical to our business. Any work
stoppages by these workers could have a material adverse effect on our business, financial condition, results of operations
and cash flows.
26
We may not realize expected benefits from our cost reduction efforts, and our profitability or our business otherwise
might be adversely affected.
We continue to focus on our cost reduction efforts in order to drive improvement across direct material procurement,
labor efficiency and product design optimization. However, these activities are complex and may involve or require
changes to our operations. If we do not successfully manage these activities, expected efficiencies and benefits might be
delayed or not realized. Additionally, risks associated with these actions and other workforce management issues include:
unfavorable political responses and reputational harm; unforeseen delays in the implementation of the restructuring
activities; additional costs; unforeseen negative impact on product quality; adverse effects on employee morale; the failure
to meet operational targets due to the loss of employees or work stoppages; and difficulty managing our operations during
or after facility consolidations, any of which may impair our ability to achieve anticipated cost reductions, harm our
business or reputation, or have a material adverse effect on our competitive position, business, financial condition, results
of operations or cash flows.
Unexpected events, including natural or man-made disasters or telecommunications failures, may increase our cost of
doing business or disrupt our operations.
The occurrence of one or more unexpected events or natural or man-made disasters, including fires, tornadoes,
tsunamis, hurricanes, earthquakes, floods and other forms of severe weather, telecommunications failures or other
disruptions impacting information technology systems in the U.S. or in other countries in which we operate or in which our
suppliers, distributors or customers are located could adversely affect our operations and financial performance. Natural or
man-made disasters, pandemic illness, equipment failures, power outages or other unexpected events could result in
physical damage to, and complete or partial closure of, one or more of our manufacturing facilities or distribution centers,
temporary or long-term disruption in the supply of component products from some local and international suppliers,
disruption in the transport of our products to distributors and end-users, delay in the delivery of our products to our
distribution centers or our inability to communicate with our distributors, customers or suppliers. Existing insurance
arrangements may not provide protection for all costs and disruption that may arise from such events. The occurrence of
any of these events could also increase our insurance and other operating costs.
Our goodwill and other intangible assets represent a substantial amount of our total assets. A decline in future
operating performance could result in impairment of goodwill or other intangible assets, which could have a material
adverse effect on our business, financial condition, results of operations or cash flows.
As of December 31, 2025, goodwill and other intangible assets totaled $1.4 billion, or approximately 50% of our total
assets. Goodwill represents the excess of the purchase price over the fair value of net assets acquired in connection with the
August 2015 acquisition of Alliance Laundry Holdings by our principal stockholder (the "BDTCP Transaction") and
subsequent acquisitions exceeding the fair value of acquired net assets. We assess annually whether there has been
impairment in the value of our goodwill and other intangible assets. If future operating performance at one or more of our
reporting units were to fall significantly below current levels, we could be required to recognize a non-cash charge to
operating earnings for goodwill or record an impairment charge related to other intangible assets. Significant negative
industry or economic trends, disruptions to our business, planned or unexpected significant changes in the use of the assets,
and sustained market capitalization declines may result in recognition of impairments to goodwill or certain other
intangible assets. Any significant goodwill or intangible asset impairment could reduce earnings in such period and have a
material adverse effect on our business, financial condition, results of operations or cash flows.
We have remediated the material weaknesses previously reported in our internal control over financial reporting, but if
we identify additional material weaknesses in the future or fail to maintain an effective system of internal control we
may not be able to accurately and timely report our financial results, which may affect investor confidence and cause us
to incur additional costs resulting in adverse impacts to our results of operations.
As a public company, we are required to establish and periodically evaluate procedures with respect to our disclosure
controls and procedures and our internal control over financial reporting. In connection with the preparation and audit of
our financial statements as of December 31, 2024, management and our independent registered public accounting firm
determined that the Company had not maintained appropriately designed controls to prevent or detect material
misstatements to our consolidated financial statements. Specifically, a material weakness was identified relating to our
failure to design, implement and maintain an adequate review and approval process with respect to manual or non-routine
journal entries. After completing several remedial actions as described in Part II, Item 9A “Controls and Procedures” we
have remediated the previously identified material weaknesses as of December 31, 2025.
27
However, there can be no assurance that the measures we have taken to date, or any actions we may take in the future,
will be effective in preventing or mitigating potential future material weaknesses. Our current controls and any new
controls that we develop may become inadequate because of changes in conditions in our business. Further, additional
weaknesses in our disclosure controls and procedures and internal control over financial reporting may be discovered in the
future. If we are then unable to remediate the material weaknesses in a timely manner and further implement and maintain
effective internal control over financial reporting or disclosure controls and procedures, our ability to record, process, and
report financial information accurately, and to prepare financial statements within required time periods could be adversely
affected, which could result in material misstatements in our financial statements that may continue undetected or a
restatement of our financial statements for prior periods. This may negatively impact the public perception of the Company
and cause investors to lose confidence in the accuracy and completeness of our financial reports, harm our ability to raise
capital on favorable terms, or at all, in the future, and subject us to litigation or investigations by regulatory authorities,
which could require additional financial and management resources or otherwise have a negative impact on our financial
condition.
In addition, we have incurred and expect to continue to incur significant expenses and devote substantial management
effort toward our efforts to achieve and maintain effective internal control over financial reporting. As a result of the
complexity involved in complying with the rules and regulations applicable to public companies, our management’s
attention may be diverted from other business concerns, which could harm our business, operating results, and financial
condition. Although we have already implemented various actions to remediate the material weakness, we may find in the
future that we do not have adequate systems, processes or personnel with the appropriate level of knowledge over financial
reporting required of public companies and may need to take additional remediation steps in the future, or engage outside
consultants, which will increase our operating expenses.
Risks Relating to Government Regulation and Litigation
Our international operations require us to comply with applicable trade, export controls and foreign anti-corruption
laws and regulations of the U.S. government and various other countries.
Doing business on a worldwide basis requires us and our subsidiaries to comply with the trade and sanctions laws and
regulations of the U.S. government and various other countries, and our failure to successfully comply with these laws and
regulations may expose us to liabilities. These laws and regulations apply to companies, individual directors, officers and
employees, and to the activities of agents acting on our behalf, and may restrict our operations, trade practices and
partnering activities.
For example, we cannot provide products or services to certain countries or individuals subject to U.S. economic
sanctions or export controls restrictions administered by the Office of Foreign Assets Control of the U.S. Department of the
Treasury or the U.S. Department of Commerce. In addition, our international operations are subject to U.S. and non-U.S.
anti-corruption laws and regulations, such as the U.S. Foreign Corrupt Practices Act (the “FCPA”). The FCPA prohibits us
from directly or indirectly offering or providing anything of value to a “foreign official” for the purpose of improperly
influencing official decisions or obtaining or retaining business or otherwise obtaining an improper business advantage,
and requires us to maintain adequate record-keeping and internal accounting practices to accurately reflect the transactions
of the company. In addition, some of the countries in which we operate have a high degree of corruption. As a result of the
above activities, we are exposed to the risk of violating the FCPA and other anti-corruption laws. Recent years have seen a
substantial increase in anti-bribery law enforcement activity, including increased enforcement activity by non-U.S.
regulators and increases in criminal and civil proceedings brought against companies and individuals. While we have
established certain safeguards and policies designed to promote compliance with applicable laws, these safeguards and
policies may prove to be less than effective and our employees or agents may engage in conduct for which we might be
held responsible. Violations of these laws or regulations could result in significant sanctions including fines, onerous
compliance requirements, the denial of export privileges, criminal fines and imprisonment, civil penalties, disgorgement of
profits, injunctions, as well as remedial measures, and can also subject us to reputational damage and loss of authorizations
needed to conduct aspects of our international business, which could adversely affect our reputation, business, financial
condition, results of operations and cash flows.
Tariffs and other trade restrictions could adversely affect our business and financial results, and we may not be able to
raise prices sufficiently to offset increased costs caused by any such tariffs.
Our business is impacted by international or cross-border trade, including the import and export of products and goods
into and out of the U.S., and trade tensions among nations. We purchase key parts and components from international
suppliers and use these parts and components in many of our products. Any country in which our products are produced or
sold may eliminate, adjust or impose new quotas, duties, tariffs, safeguard measures, anti-dumping duties, cargo
28
restrictions to prevent terrorism, restrictions on transfer of currency, or other charges or restrictions, any of which could
have an adverse effect on our business, financial condition, results of operations and cash flows. See “Item 1A. Risk
Factors - Risks Relating to Our Business—Price fluctuations or shortages of raw materials could adversely affect our
operations.” Further, any emerging protectionist or nationalist trends in the U.S. or any of the countries in which our
products are produced or sold could affect the trade environment. In 2025, the Trump Administration announced additional
tariffs on goods from all countries pursuant to the International Emergency Economic Powers Act. These tariffs were later
found to have exceeded presidential authority and were invalidated by the courts. Following such ruling, President Trump
implemented a 150-day “global tariff” of 10% effective February 24, 2026, using presidential powers under the Trade Act
of 1974, and indicated a desire to increase such “global tariff” to 15% and to seek to extend such tariffs under other
statutes. We sell our products globally, and if other countries enact retaliatory tariffs in response to U.S. trade policy, our
sales into such countries may be adversely impacted.
To date, tariffs have not materially impacted our business or financial results, in large part due to our “local for local”
production approach, by which our manufacturing plants in each region fulfill the majority of the volume requirements in
their respective regions. Currently, our largest import exposure arises out of Mexico; however, the majority of our imported
goods from Mexico currently originate under the U.S.-Mexico-Canada Agreement (“USMCA”) and thus enter the U.S.
tariff-free. The USMCA is currently undergoing its mandatory Joint Review, with all three countries required to agree by
July 1, 2026 on whether to extend the agreement for an additional 16 years. Key issues under review include increased
trade deficits, Chinese investment and transshipment through Mexico, and potential strengthening of rules of origin
requirements. If the parties do not agree to extend the USMCA, or if the agreement is amended to impose more restrictive
terms, our imports from Mexico could become subject to increased tariffs or other trade restrictions. We carry some
exposure arising from export of materials from China, but this has historically been an immaterial part of our cost base. We
cannot ensure that tariffs will not materially impact on our business or financial results in the future.
In order to mitigate the impacts that various tariffs may have on the cost and availability of our manufacturing inputs,
we have taken, and in the future may take, various actions, including increasing prices to our customers through permanent
price increases or surcharges, increasing inventory levels on hand in advance of tariffs or to protect against material
availability, and transitioning our sourcing over the long term away from vendors in countries most impacted by tariffs. At
this time, the overall effectiveness of our responses in managing these challenges remains uncertain and depends on
multiple factors, including the duration and potential expansion of current tariffs, future changes to tariff rates, scope of
enforcement, retaliatory measures by impacted exporting countries, inflationary effects and broader macroeconomic
responses or changes to consumer purchasing behavior. If we are unable to effectively mitigate tariff-related risks through
price increases or inventory and source adjustments, financial performance and growth prospects could be negatively
affected.
Any of these mitigation efforts comes with risks to our reputation, business, financial condition, results of operations
and cash flows. Raising prices to end customers could result in them choosing a more cost effective manufacturer.
Increasing inventory stockpiles, if such stockpiles are not used in current production, could result in us having to lower
prices in order to sell down inventory or in inventory write-offs. Changing our sources of raw materials may require us to
increase our cost of engineering in order to test and approve these new sources, negatively impact the availability of
inventory when needed for production, or diminish overall product quality.
We could incur significant costs in complying with EHS laws and regulations and could be adversely affected by
liabilities or obligations imposed under such laws.
We are subject to comprehensive and frequently changing foreign, federal, state and local EHS laws and regulations,
including laws and regulations governing emissions of air pollutants, including greenhouse gas emissions, discharges of
wastewater and stormwater, releases of hazardous materials to soil and water, the transportation, treatment, storage and
disposal of hazardous wastes and the regulation of, and exposure to, hazardous materials in current or former products, the
workplace or the environment. We could incur significant costs, including fines, cleanup costs and third-party claims, as a
result of violations of or liabilities under these laws and regulations. We may also incur significant costs to achieve or
maintain compliance with EHS laws in the future, including for obligations to install pollution control equipment or
eliminate certain hazardous materials from our products.
In addition, it is difficult to accurately predict the nature and extent of environmental liabilities and obligations that
may result from laws or regulations adopted in the future and how existing or future laws and regulations will be
administered or interpreted. For example, changes in environmental laws, including laws relating to energy and water
consumption and efficiency and greenhouse gas emissions, will likely require additional investments in product designs,
which may be more expensive or difficult to manufacture, qualify for applicable certifications and sell, or may involve
additional product safety risks, and could increase environmental compliance expenditures. See “Item 1A. Risk Factors -
Risks Relating to Government Regulation and Litigation-Energy efficiency, water usage standards and other product-
29
related standards could adversely affect our industry.” Furthermore, various jurisdictions and regulators may take different
approaches to and impose differing or inconsistent requirements under environmental laws, which may make it more costly
or difficult for us to sell our products (including by requiring that we monitor such developments, incur increased test and
certification costs, increase time-to-market and develop additional country-specific variants for certain products) or prevent
us from selling certain products in certain geographic markets.
Our facilities and operations also are subject to various hazards incidental to the manufacturing and transportation of
commercial-grade laundry equipment. We are also subject to potential strict, joint and several liability for the investigation
and remediation of contamination, including contamination caused by other parties, at properties we currently own or
operate and previously owned or operated and at other properties where we or our predecessors have arranged for the
disposal of hazardous substances. Some of our facilities have a history of industrial and commercial operations or are
located on property with previously identified contamination, and we may incur significant additional costs, including
cleanup costs and other environmental liabilities, as a result of environmental conditions that are existing or discovered or
obligations that are imposed in the future. From time to time, we have been and may, in the future, be involved in
administrative and judicial proceedings, investigation and remediation activities, inquiries and other claims relating to these
and other environmental matters. Our existing insurance or any additional insurance may not provide adequate coverage
against potential liability resulting from any such liabilities, proceedings, inquiries and claims. As a result, the aggregate
amount of future cleanup costs and other environmental liabilities and obligations could have a material adverse effect on
our business, financial condition, results of operations and cash flows.
We are subject to risks related to environmental, social and governance (“ESG”) and sustainability laws, regulations,
policies and initiatives.
There is continued focus from various stakeholders and regulatory authorities in the United States, European Union
and other jurisdictions in which we operate, on ESG and sustainability matters. Stakeholders’ expectations are not uniform,
and proponents and opponents of various ESG- and sustainability-related matters have increasingly resulted in a range of
activism and legal and regulatory developments. If we do not succeed in meeting, or are perceived as failing to meet,
stakeholders’ expectations, whether in support of or against ESG- and sustainability-related matters, or our publicly-stated
goals, or if we do not effectively respond to new or revised legal, regulatory or reporting requirements concerning such
matters, we may be subject to litigation risks, regulatory enforcement and sanctions, our reputation may suffer and our
stock price may be negatively affected, among other potential impacts. New, increasingly stringent, revised or conflicting
ESG and sustainability laws, regulations and expectations in and across the jurisdictions in which we do business may
increase compliance burdens and costs for us and for third parties throughout our global supply chain. For example, the
Corporate Sustainability Reporting Directive (“CSRD”) enacted in the European Union and certain laws enacted in
California will require us to report on various sustainability-related information, including greenhouse gas emissions.
These laws also have been or may be subject to amendments, delays in implementation or legal challenges, the outcomes of
which are difficult to predict, as is their impact on us. In addition, there are existing and changing requirements and
expectations in various jurisdictions that may require us to proactively monitor the ESG practices of our value chain. See
“Item 1A – Risk Factors - Risks Relating to Our Business—Our business depends on the performance of our third-party
distributors, route operators and suppliers who are subject to additional risks that are beyond our control, including those
that could harm our business, financial condition and results of operations.”
Energy efficiency, water usage standards and other product-related standards could adversely affect our industry.
Certain of our washer products are subject to foreign, federal, state and local laws and regulations which pertain to
energy and water usage and efficiency. There are federal standards for energy and water efficiency for both residential
(consumer) and small-chassis commercial washers. There is also a federal energy efficiency standard for residential
(consumer) dryers. Currently our equipment is required to be compliant with the guidelines of numerous regulatory
agencies worldwide.
We anticipate there will continue to be proposals and actions by legislators and regulators at the foreign, federal, state
and local levels to modify or expand laws and regulations relating to energy and water usage and efficiency and other
similar concerns. For example, in 2024, the U.S. Department of Energy (the “DOE”) finalized new energy and water
efficiency standards for residential clothes washers and dryers which will require compliance from March 2028
(“Efficiency Standards”). Compliance with these standards would require us to make changes to the design of certain of
our washer and dryer products, which would require significant engineering, manufacturing, design and equipment costs.
In February 2025, the DOE announced a postponement of the implementation of the Efficiency Standards and in May
2025, the DOE proposed to rescind or reduce 47 regulations related to electric and gas appliances, including water use and
conservation standards related to residential clothes washers. While the ultimate outcome of such regulatory developments,
as well as their future enforcement, is difficult to predict, these or other similar regulatory changes applicable to our
products may impact demand for, or the cost and difficulty of producing or selling, our products and services, create short-
30
term market conditions which are economically disadvantageous to us, require additional investments, make our products
more expensive or difficult to qualify for applicable certifications, increase environmental compliance expenditures, or
involve additional product safety risks. Any of the foregoing could have a material adverse effect on our business, financial
condition, results of operations and cash flows.
We are subject to risks of future legal proceedings.
At any given time, we are a defendant in various legal proceedings and litigation arising in the ordinary course of
business. These may relate to, among other things, product safety, personal injuries, intellectual property rights,
cybersecurity incidents, contract-related claims, taxes, EHS matters, employee health and safety, competition laws and
laws governing improper business practices. For example, we have in the past been subject to litigation related to
allegations of anti-trust and labor law violations. The possibility of such litigation, and its timing, is in large part outside
our control. Although we maintain insurance policies, we can make no assurance that this insurance will be adequate to
protect us from all material expenses related to potential claims or that these levels of insurance will be available in the
future at commercially reasonable prices or at all.
Additionally, as a global business, we are subject to complex laws and regulations in the U.S. and other countries in
which we operate. These laws and regulations, including interpretations thereof, may change from time to time. A
significant judgment against us, the loss of a significant permit or other approval or the imposition of a significant fine or
penalty could have a material adverse effect on our business, financial condition, results of operations and cash flows. See
“Part II, Item 3. Legal Proceedings,” in this Annual Report for further information regarding legal proceedings involving
the Company.
Our employees and our third-party distributors, route operators and suppliers may engage in misconduct or other
improper activities, including non-compliance with regulatory standards and requirements.
We are exposed to the risk that our employees and our third-party distributors, route operators and suppliers may
engage in fraudulent conduct, bribery or other illegal activity. Misconduct by these parties could include intentional,
reckless or negligent conduct or disclosure of unauthorized activities to us that violate the regulations of regulatory
authorities, including those laws requiring the reporting of true, complete and accurate information to such authorities, or
laws that require the reporting of financial information or data accurately. We are subject to extensive laws and regulations
intended to prevent fraud, misconduct, kickbacks, self-dealing and other abusive practices.
We have a code of conduct applicable to all of our employees as well as a business partners code of conduct applicable
to our third-party distributors, route operators and suppliers, but it is not always possible to identify and deter misconduct
by employees and other third parties, and the precautions we take to detect and prevent this activity may not be effective in
controlling unknown or unmanaged risks or losses or in protecting us from governmental investigations or other actions or
lawsuits stemming from a failure to comply with these laws or regulations. Failure of our employees and our third-party
distributors, route operators and suppliers to comply with applicable laws may subject us to litigation or other reputational
risks. Additionally, we have been in the past, and may again be in the future, subject to the risk that a person could allege
such fraud or other misconduct, even if none occurred. If any such actions are instituted against us, and we are not
successful in defending ourselves or asserting our rights, those actions could have a significant impact on our business,
including the imposition of civil, criminal and administrative penalties, damages, monetary fines, contractual damages,
reputational harm, diminished profits and future earnings, and curtailment of our operations, any of which could adversely
affect our ability to operate our business and our results of operations.
Changes in accounting standards may adversely affect us.
Our financial statements are subject to the application of U.S. generally accepted accounting principles (“GAAP”),
which is periodically revised or expanded. Accordingly, from time to time, we are required to adopt new or revised
accounting standards issued by recognized authoritative bodies, including the Financial Accounting Standards Board
(“FASB”) and the Securities and Exchange Commission. Such changes could have a material impact on how we report our
financial condition and results of operations.
Our business may be impacted by new or changing tax laws or regulations and actions by international, federal, state,
and local agencies, or by how judicial authorities apply tax laws.
Our operations are subject to various international, federal, state and local tax laws and regulations. Tax laws are
dynamic and subject to change as new laws are passed and new interpretations of the law are issued or applied. In many
cases, the application of tax laws is uncertain and subject to differing interpretations, especially when evaluated in the
context of a new administration for the U.S. federal government. Moreover, if and to the extent that the U.S. federal income
31
tax code is changed as part of a comprehensive corporate tax reform plan or otherwise, our net income may be impacted
positively or negatively. Alternately, changes in tax laws could negatively impact our ability to continue to source high-
quality raw materials and components at costs similar to those which we currently obtain.
In 2025, changes to U.S. federal tax law and the limitation of the deductibility of our officer compensation under IRC
Section 162(m), increased our effective tax rate compared to the prior year. Further, the One Big Beautiful Bill Act
(OBBBA) was enacted on July 4, 2025 and amends key business tax provisions, including the “GILTI” provision, other
international provisions, interest deduction limitations and reinstates the ability to currently expense research and
experimental expenditures. While the OBBBA had no material impact on our provision for income taxes as of December
31, 2025, certain provisions of the OBBBA may change the timing of cash payments in the current fiscal year and future
periods. Additionally, future legislative or regulatory changes could increase our effective tax rate, alter the timing of cash
obligations and adversely affect our financial results and liquidity. We cannot predict future changes to tax laws and
regulations or the impact such changes may have on our business. See Note 15 - Income Taxes to our consolidated
financial statements in this Annual Report for further information regarding Income tax-related risks to the Company.
Risks Relating to Intellectual Property Matters
Failure to adequately protect our intellectual property rights may have a material adverse effect on our results of
operations or our ability to compete.
We attempt to protect our intellectual property rights in the U.S. and in foreign countries through a combination of
patent, trademark, copyright and trade secret laws, as well as licensing agreements and agreements preventing the
unauthorized disclosure and use of our intellectual property. These efforts are critical to safeguarding the proprietary
designs, technologies and control systems in our commercial laundry equipment that distinguish us in the market. We
cannot assure that these protections will be adequate to prevent competitors from copying or reverse engineering our
products, or independently developing and marketing products that are substantially similar to our own. We may be unable
to obtain or maintain adequate protections for certain of our intellectual property in the U.S. or foreign countries and third
parties may be able to successfully challenge, oppose or invalidate our intellectual property rights. Our patent and
trademark applications we may file in the future may never be granted and, even if we are successful in obtaining effective
protection, it is expensive to maintain these rights, both in terms of application and maintenance costs, and the time and
cost required to defend our rights could be substantial. Limited resources or strategic priorities might constrain our ability
to secure comprehensive intellectual property coverage across all regions where our products are sold, leaving
vulnerabilities in our portfolio.
Further, our intellectual property rights may not receive the same degree of protection in foreign countries as they
would in the U.S. because of the differences in foreign trademark, patent and other laws concerning proprietary rights. In
some markets, differing legal standards could allow competitors to exploit our innovations, undermining our ability to
maintain a differentiated position. The laws of some foreign countries do not afford intellectual property protection to the
same extent as the laws of the U.S., and many companies have encountered significant problems in protecting and
defending intellectual property rights in certain foreign jurisdictions. For example, the requirements for patentability may
differ in certain countries, particularly in developing countries. Moreover, our ability to protect and enforce our intellectual
property rights may be adversely affected by unforeseen changes in foreign intellectual property laws, particularly in
developing countries, and there may be unforeseen changes in intellectual property rights laws, which could make it
difficult for us to stop the infringement of our patents or the misappropriation or other violation of our other intellectual
property rights. Such failure or inability to obtain or maintain adequate protection of our intellectual property rights for any
reason could have a material adverse effect on our business, financial condition, results of operations and cash flows, as
third parties may be able to commercialize and use products and technologies that are substantially the same as ours to
compete with us without incurring the development and licensing costs that we have incurred.
Failure to protect the confidentiality of our trade secrets or other proprietary information could harm our business,
financial condition, results of operations and competitive position.
We rely on trade secrets and confidentiality agreements to protect our unpatented know-how, technology and other
proprietary information and to maintain our competitive position. However, trade secrets and know-how can be difficult to
protect. We seek to protect these trade secrets and other proprietary technology, in part, by entering into non-disclosure and
confidentiality agreements with parties who have access to them, such as certain of our employees, corporate collaborators,
outside contractors, consultants, advisors and other third parties, but we cannot guarantee that we have entered into such
agreements with each party that may have or has had access to our trade secrets or proprietary or confidential information,
including our technology and processes. In addition, despite these efforts, we have experienced and may in the future
experience breaches of confidentiality agreements and disclosure of our proprietary or confidential information (including
32
our trade secrets) by these parties, including former employees. We may not be able to obtain adequate remedies for such
breaches. Enforcing a claim that a party illegally disclosed or misappropriated a trade secret is difficult, expensive and
time-consuming, and the outcome is unpredictable.
In addition, some courts inside and outside the U.S. are less willing or unwilling to protect trade secrets. If any of our
trade secrets were to be lawfully obtained or independently developed by a competitor or other third party, we would have
no right to prevent them from using that technology or information to compete with us. If any of our trade secrets were to
be disclosed to or independently developed by a competitor or other third party, it could have a material adverse effect on
our competitive position, business, financial condition, results of operations and cash flows.
If our trademarks, trade names and domain names are not adequately protected, maintained and enforced, we may not
be able to build name recognition in our markets of interest and our competitive position may be harmed.
We rely on trademark registrations and enforcement measures to protect our brand identity, logos and other distinctive
marks and to maintain our competitive position in the marketplace. If we are unable to successfully register our trademarks,
trade names and domain names and establish name recognition based on our trademarks and trade names, we may not be
able to build name recognition in our target markets and our ability to maintain our competitive position in the marketplace
may be adversely affected. In addition, competitors or other third parties have in the past, and may in the future, adopt trade
names or trademarks similar to ours, thereby impeding our ability to build brand identity, interfering with our consumer
communications or infringing or otherwise decreasing the value of our trademarks, domain names and other intellectual
property and proprietary rights possibly leading to market confusion and potentially requiring us to pursue legal action.
Furthermore, the laws protecting trademarks and the regulations governing domain names and other intellectual property
and proprietary rights could change in ways that block or interfere with our ability to use relevant domains or our current
brands. In addition, there could be potential trade name or trademark infringement claims brought by owners of other
registered trademarks or trademarks that incorporate variations of our unregistered trademarks or trade names.
We may become involved in legal proceedings to enforce our intellectual property rights or relating to allegations that
we have infringed third party intellectual property rights, the outcome of which would be uncertain and could be costly,
time-consuming, and have a material adverse effect on our business.
Third parties may infringe, misappropriate or otherwise violate our intellectual property rights, which could require us
to pursue costly and time-consuming enforcement proceedings with uncertain outcomes. Despite our efforts to protect our
intellectual property, third parties may attempt to use our technologies, designs, brands or proprietary information without
our permission, which could adversely affect our commercial success. We may discover competing products or services in
the market that use our protected intellectual property without authorization. While we actively monitor for unauthorized
use of our intellectual property and may take enforcement actions, such as initiating claims or litigation against third parties
for infringement, misappropriation or other violation of our intellectual property rights or other proprietary rights or to
establish the validity of such rights, detecting and addressing all potential infringements can be difficult and resource-
intensive. Furthermore, our efforts to enforce our intellectual property rights may be met with defenses, counterclaims and
countersuits attacking the validity and enforceability of our intellectual property rights, and we may not always prevail in
these matters. Additionally, because of the substantial amount of discovery required in connection with intellectual
property litigation, there is a risk that some of our confidential information could be compromised by disclosure during this
type of litigation. Any litigation, whether or not it is resolved in our favor, could result in the impairment or loss of portions
of our intellectual property, which may materially and adversely affect our business, financial condition, results of
operations and cash flows.
In some jurisdictions, particularly internationally, enforcement of our intellectual property rights may be especially
challenging or impractical. While we intend to protect our intellectual property rights in the major markets for our products,
we cannot ensure that we will be able to initiate or maintain similar efforts in all jurisdictions in which we may wish to
market our products. Additionally, even if we successfully enforce our rights, the process could be lengthy and expensive,
during which time the infringing products may cause market confusion or diminish our competitive position. These
challenges in protecting and enforcing our intellectual property rights against third-party infringement could have a
material adverse effect on our business, financial condition, results of operations and cash flows, and divert management’s
attention from our core business operations.
Further, we have received, and may in the future receive, notices alleging infringement of the intellectual property
rights of third parties. Certain of such notices have proceeded to litigation, and similar claims may arise and proceed to
litigation in the future. These claims and related allegations, regardless of their merit or our defenses, could be time-
consuming, result in considerable litigation costs, result in injunctions against us or the payment of damages by us, require
significant amounts of management time, result in the diversion of significant operational resources and expensive changes
33
to our business model, result in the payment of substantial damages or injunctions against us, result in ongoing royalty
payments or significant settlement payments, or require us to enter into costly royalty or licensing agreements, but such
licenses or arrangements may not be available on terms acceptable to us or at all. Any payments we are required to make or
any injunctions we are required to comply with as a result of such infringement actions could materially and adversely
affect our business, financial condition, results of operations and cash flows. In addition, we may be unable to obtain or use
on terms that are favorable to us, or at all, licenses or other rights with respect to intellectual property we do not own. These
risks have been amplified by the increase in third parties whose sole or primary business is to assert such claims.
Even if resolved in our favor, litigation or other legal proceedings relating to intellectual property may cause us to
incur significant expenses, have a material adverse effect on our business, financial condition, results of operations and
cash flows, and could distract our technical and management personnel from their normal responsibilities.
We may be subject to claims that our employees, consultants, advisors or independent contractors have wrongfully used
or disclosed alleged trade secrets or other confidential information from their current or former employers, or other
third parties or claims asserting ownership of what we regard as our own intellectual property or proprietary rights.
Although we try to ensure that our employees, consultants, advisors and independent contractors do not use the
confidential or proprietary information, trade secrets or know-how of others in their work for us, we may be subject to
claims that we or these individuals have, inadvertently or otherwise, improperly used or disclosed intellectual property
rights, confidential or proprietary information, trade secrets or know-how, of any such individual’s current or former
employer or other third party. Additionally, to the extent we hire personnel from competitors, we may be subject to
allegations that such personnel have divulged proprietary or other confidential information to us.
Litigation may be necessary to defend against these claims. If we fail in defending any such claims, in addition to
paying monetary damages, we may lose valuable intellectual property rights or personnel. Even if we are successful in
defending against such claims, litigation could result in substantial costs and be a distraction to management.
Further, while it is our policy to require certain of our employees, suppliers, consultants, advisors and independent
contractors who may be involved in the conception or development of intellectual property rights to execute agreements
assigning such intellectual property rights to us, we cannot guarantee that we have entered into such agreements with each
party that may have developed intellectual property rights for us. Individuals involved in the development of intellectual
property rights for us, whether or not subject to such assignment agreements, may make adverse ownership claims to our
current and future intellectual property rights. The assignment of intellectual property rights in agreements entered into by
individuals involved in the development of intellectual property rights for us may be insufficient or breached, and we may
not be able to obtain adequate remedies for such breaches. We may be forced to bring claims against third parties, or
defend claims that they may bring against us, to determine the ownership of what we regard as our intellectual property
rights. Any of the foregoing could have a material adverse effect on our competitive position, business, financial condition,
results of operations and cash flows.
Some of our products and services contain open source software, which may pose particular risks to our proprietary
software, products and services in a manner that could have a material and adverse effect on our business, financial
condition, results of operations and cash flows.
We use open source software in connection with our products and services and anticipate using open source software
in the future. Our use of open source software may also pose particular cybersecurity risks to our proprietary software and
systems. Because the source code for open source software is publicly available, it may be easier for hackers and other
third parties to identify vulnerabilities and determine how to breach our sites and systems that rely on such software. Some
open source software licenses require users who distribute open source software as part of their own software product to
publicly disclose all or part of the source code to such software product or to make available any derivative works of the
open source code on unfavorable terms or at no cost, and we may be subject to such terms.
While we monitor our use of open source software and try to ensure that none is used in a manner that would require
us to disclose our proprietary source code or that would otherwise breach the terms of an open source agreement, such use
could inadvertently occur, or could be claimed to have occurred, in part because open source license terms are often
ambiguous. The terms of many open source licenses have not been interpreted by U.S. or foreign courts, and there is a risk
that these licenses could be construed in a way that could impose unanticipated conditions or restrictions on our ability to
commercialize our technology. As a result, we could face claims from third parties claiming ownership of, or demanding
release of, derivative works that we have developed using such open source software, which could include proprietary
source code, or otherwise seeking to enforce the terms of the applicable open source license. These claims could result in
litigation and could require us to make our software source code freely available, purchase a costly license or cease offering
34
the implicated products or services unless and until we can recode or reengineer such source code in a manner that avoids
infringement. This reengineering process could require us to expend significant additional research and development
resources, and we may not be able to complete the reengineering process successfully.
In addition to risks related to open source license requirements, use of certain open source software can lead to greater
risks than use of third-party commercial software, as open source licensors generally do not provide support, warranties,
indemnification or other contractual protection regarding infringement claims or the quality of the code. Open source
licensors generally do not provide assurances of non-infringement or functionality, and there is typically no support
available. We cannot ensure that the authors of such open source software will implement or push updates to address
security risks, or that such software will continue to be maintained or developed. There is little legal precedent in this area
and any actual or claimed requirement to disclose our proprietary source code or pay damages for breach of contract could
harm our business and could help third parties, including our competitors, develop products and services that are similar to
or better than ours. Any of the foregoing could have a material adverse effect on our competitive position, business,
financial condition, results of operations and cash flows. These risks may be difficult to eliminate or manage and, if not
adequately addressed, could have an adverse effect on our competitive position, business, financial condition, results of
operations and cash flows.
Risks Relating to Data Compliance, Cybersecurity and Artificial Intelligence
The protection of our data involves risks regarding potential failure to comply with data privacy and security laws,
regulations and other obligations, which could damage our reputation, harm our operating results or result in
significant liabilities or other adverse consequences that could have a material and adverse effect on our business.
We collect, store, process and transmit sensitive data, including personal information from customers, employees and
business partners, through our equipment financing program and Speed Queen and Huebsch apps, subjecting us to a
complex and evolving array of data privacy laws and regulations in the U.S. and abroad. These include the California
Consumer Privacy Act, as amended by the California Privacy Rights Act (collectively, the “CCPA”), which broadly
defines personal information and requires companies that process information of California residents to make disclosures to
consumers about their data collection, use and sharing practices, as well as imposes stringent requirements on how we
handle personal information, such as payment data, increasing our compliance burden and exposure to potential penalties.
The CCPA also gives California residents expanded privacy rights and protections, such as affording them the right to opt
out of certain data sharing with third parties, right to access and request deletion of their information and provides a new
cause of action for certain data breaches that result in the loss of personal information. This private right of action has
increased the likelihood of, and risks associated with, data breach litigation. The law also prohibits covered businesses from
discriminating against California residents (for example, charging more for services) for exercising any of their CCPA
rights. The CCPA provides for severe civil penalties and statutory damages for violations. Certain laws and regulations
may also require us to implement security measures to protect our systems and internet-of-things (“IoT”) connected
devices. For example, the California Internet of Things Security Law, which became effective in 2020, requires us to
implement reasonable security measures for IoT devices, and failure to do so could expose us to penalties. Moreover, laws
in all 50 U.S. states require businesses to provide notice under certain circumstances to consumers whose personal data has
been disclosed as a result of a data breach. It is possible that new laws, regulations and other requirements, or amendments
to or changes in interpretations of existing laws, regulations and other requirements, may require us to incur significant
costs, implement new processes, or change our processing of information, including Personal Information, and business
operations. It is unclear how the laws and regulations relating to the collection, processing and use of personal data will
further develop in the U.S., and to what extent this may affect our operations in the future.
In addition, we are required to comply with various global data privacy regulations, such as the European Union’s
General Data Protection Regulation (the “EU GDPR”) and the United Kingdom (“UK”) equivalent (the “UK GDPR” and,
together with the EU GDPR, the “GDPR”). The GDPR imposes stringent requirements for controllers and processors of
personal data of individuals within the European Economic Area (“EEA”) or the UK. Companies that must comply with
the GDPR face increased compliance obligations and risk, including more robust regulatory enforcement of data protection
requirements. Additionally, although currently the EU GDPR and UK GDPR remain largely aligned, the UK has
announced plans to reform the country’s data protection legal framework in its Data Reform Bill, which will introduce
significant changes from EU GDPR. This may lead to additional compliance costs and could increase our overall risk
exposure as we may no longer be able to take a unified approach across the EEA and the UK, and we will need to amend
our processes and procedures to align with the new framework. Implementing mechanisms to endeavor to ensure
compliance with the GDPR and relevant local legislation may be onerous and may adversely affect our business, financial
condition, results of operations and cash flows. While we have taken steps to comply with the GDPR where applicable, our
efforts to achieve and remain in compliance with GDPR may not be fully successful.
In addition to the foregoing, failure to safeguard personal data in our possession or control or to comply with
applicable privacy laws and regulations could result in regulatory investigations, reputational damage, orders to cease or
35
change use of our data, significant fines-such as up to 20 million Euros (£17.5 million) or 4% of our annual global revenue
under the GDPR, whichever is greater-or civil litigation, including pursuant to a private right of action for data breaches
under the CCPA or pursuant to class-action litigation, which could heighten our legal and financial risks. These
proceedings and any subsequent adverse outcomes may subject us to significant negative publicity and an erosion of trust.
Further, while we strive to implement privacy policies that are accurate, comprehensive and compliant with applicable
laws, regulations, rules and industry standards, we cannot ensure that our privacy policies and other statements regarding
our practices will be sufficient to protect us from claims, proceedings, liability or adverse publicity relating to data privacy
and security. Although we endeavor to comply with our privacy policies, we may at times fail to do so or be alleged to
have failed to do so. Our privacy policies and other documentation that provide promises and assurances about data privacy
and security can subject us to potential government or legal action if they are found to be deceptive, unfair or
misrepresentative of our actual practices. Any inability to adequately address privacy concerns, even if unfounded, could
result in additional cost and liability to us, damage our reputation and harm our business.
The protection of our data involves risks regarding security incidents which could damage our reputation, harm our
operating results or result in significant liabilities or other adverse consequences that could have a material and adverse
effect on our business.
We rely on the proper functioning, availability and uninterrupted operation of our computer systems, hardware,
software, technology infrastructure and online sites and networks for both internal and external operations that are critical
to our business (collectively, “IT Systems”) and any failure, interruption or breach in the security of such IT Systems could
severely disrupt our operations and adversely affect our business or financial condition. We own and manage some of these
IT Systems but also rely on third parties for a range of IT Systems and related products and services, including but not
limited to third-party-hosted solution providers.
Information security threats, including cybersecurity threats, could pose risks to the security of our systems and
networks, as well as the confidentiality, availability and integrity of our data. Cyberattacks are expected to accelerate on a
global basis in frequency and magnitude as threat actors are becoming increasingly sophisticated in using techniques and
tools-including artificial intelligence (“AI”)-that circumvent security controls, evade detection and remove forensic
evidence. Recently, the United States government has raised concerns about a potential increase in cyberattacks generally
as a result of the military conflict between Russia and Ukraine and the related sanctions imposed by the United States and
other countries and the ongoing conflict between Israel and Gaza and the US-Israel-Iran conflict. Although we maintain
systems and processes that are designed to protect the security of our technology infrastructure, security incidents-such as
physical or electronic break-ins, sabotage, intentional acts of vandalism, terrorism and other cyber-related attacks-can occur
that could compromise the security of our infrastructure, thereby exposing our confidential information to unauthorized
access by third parties. Any material incidents could cause us to experience financial losses that are either not insured
against or not fully covered through any insurance maintained by us and increased expenses related to addressing or
mitigating the risks associated with any such material incidents. Despite our efforts to ensure the integrity of our systems,
as cyber threats evolve and become more difficult to detect and successfully defend against, one or more cyber threats
might defeat the measures that we or our vendors take to anticipate, detect, avoid or mitigate such threats. For example, we
experienced a prior data breach incident on information systems of an acquired company that resulted in unauthorized
access to personal data. We detected the access and notified governmental agencies and impacted individuals in a
timeframe which we believe minimized any financial, operational and reputational risk, and at no point was our ability to
generate revenues disrupted. However, if future attacks occur, there is no assurance we will be able to detect the incident in
a timely manner or at all.
We also depend on the security of our networks and that of our third-party service providers. These infrastructures
may be vulnerable to cybersecurity incidents, acts of vandalism, computer viruses, misplaced or lost data, programming or
human errors or other similar events. While we generally perform cybersecurity diligence on our key service providers,
because we do not directly control any of such parties’ information security operations, we cannot ensure the cybersecurity
measures they take will be sufficient to protect any information we share with them. Due to applicable laws and regulations
or contractual obligations, we may be held responsible for cyberattacks or other similar incidents attributed to our service
providers as they relate to the information we share with them. Any actual or perceived jeopardization of the security of our
customers’ confidential information resulting from unauthorized use of our, or our third-party service providers’, networks
could severely damage our reputation and our relationship with our customers as well as expose us to risks of litigation,
liability or other penalties, all of which could have a material adverse effect on our business, financial condition, results of
operations and cash flows.
We may be required to expend significant capital and other resources to protect against, remedy or alleviate these and
related problems, and we may not be able to remedy these problems in a timely manner, or at all.
36
Our connected products and IoT platform present unique cybersecurity risks.
Our cloud-connected commercial laundry equipment platform encompasses a significant and growing number of
machines and serves millions of users globally. This IoT infrastructure expands our areas of vulnerability beyond
traditional enterprise systems. Vulnerabilities in device firmware, communication protocols, mobile applications, or cloud
services could be exploited to disrupt customer operations, compromise user data, or serve as an entry point for broader
network intrusions. The distributed nature of these devices across customer locations worldwide presents additional
challenges for monitoring, patching, and incident response. A security incident affecting our connected products could
damage customer trust, result in product liability claims, and require costly remediation efforts.
The convergence of Operational Technology (“OT”) and Information Technology increases our exposure to
cybersecurity risk.
As a global manufacturer operating six production facilities across North America, Europe, and Asia, we rely on
operational technology systems to control and monitor manufacturing processes. The increasing integration of these OT
systems with our IT networks enhances operational efficiency but also introduces cybersecurity risks. A successful attack
on our OT environment could disrupt manufacturing operations, damage equipment, compromise product quality, or create
safety hazards. Securing OT systems presents distinct challenges, including managing legacy equipment with limited
security capabilities, accommodating extended asset lifecycles, and balancing security controls with operational continuity.
Our use of AI technologies may not be successful, which may adversely affect our reputation, business and financial
condition.
We currently use machine learning and AI technologies licensed from third parties to enhance our commercial laundry
equipment and systems. These AI technologies, which we integrate into our products and solutions and expect to expand
on, support features such as predictive maintenance, usage analytics and optimization of our laundry systems. The
integration of AI technologies into our laundry equipment and systems may result in new or enhanced governmental or
regulatory scrutiny, litigation, confidentiality or security risks, ethical concerns, legal liability or other complications. A
failure on our part to develop solutions to ensure compliance with regulatory regimes may result in unforeseen costs or
delays in deploying new and improved features using AI technologies. In some cases, we are subject to contractual
limitations from our AI technology providers that restrict how we can use certain data in connection with the training and
use of AI systems. Further, while we aim to develop and use AI responsibly and attempt to mitigate ethical and legal issues
presented by its use, we may ultimately be unsuccessful in identifying or resolving issues before they arise.
Uncertainty around emerging AI technologies may require additional investment in the development and maintenance
of proprietary datasets and machine learning models, development of new approaches related to the collection and use of
training data, and development of appropriate protections and safeguards for handling the use of customer data with AI
technologies, which may be costly and could impact our expenses. AI technologies from third parties that are incorporated
into our laundry systems and business processes may use algorithms, datasets or training methodologies that may be flawed
or contain deficiencies that could be difficult for us to detect during testing, and such AI technologies can pose risks from
an intellectual property, data protection and privacy perspective. Use of third-party AI-powered software in connection
with our business or services, may lead to the inadvertent disclosure or incorporation of our confidential information into
publicly available training sets, which may impact our ability to realize the benefit of, or adequately maintain, protect and
enforce our intellectual property or confidential information, harming our competitive position and business. As the
utilization of AI becomes more prevalent, we anticipate that it will continue to present new or unanticipated ethical,
reputational, technical, operational, legal, competitive and regulatory issues, among others. We expect that our
incorporation of AI in our business will require additional resources. We may not have adequate access to such resources
or the ability to attract talent in the product development, data science and engineering fields to develop and implement the
tools necessary to compete. Further, our competitors or other third parties may incorporate AI into their products more
quickly or more successfully than us, which could impair our ability to compete effectively.
Additionally, we may face challenges in adequately complying with new or changing laws, regulations or industry
standards, or contractual requirements regarding the use of licensed AI technologies and data in our commercial laundry
systems and solutions and may incur significant operational costs in our attempts to do so. It is possible that new laws and
regulations will be adopted in the United States and in non-U.S. jurisdictions, or that existing laws and regulations may be
interpreted in ways that would affect the operation of our products and solutions and the way in which we use AI and
similar technologies. We may not be able to adequately anticipate or respond to these evolving laws and regulations, and
we may need to expend additional resources to adjust our offerings in certain jurisdictions if applicable legal frameworks
are inconsistent across jurisdictions. Moreover, because these technologies are themselves highly complex and rapidly
37
developing, it is not possible to predict all of the legal or regulatory risks that may arise relating to our use of such
technologies. Further, the cost to comply with such laws or regulations could be significant and would increase our
operating expenses, which could adversely affect our business, financial condition, results of operations and cash flows.
Any of the foregoing challenges presented with our use of AI may result in decreased demand for our laundry
solutions, harm to our business, results of operations or reputation, legal liability, regulatory action or failure to achieve
expected results.
Risks Relating to Our Indebtedness
Our substantial indebtedness could adversely affect our financial condition.
At December 31, 2025, we had $1,365.2 million of indebtedness outstanding, consisting of $1,365.0 million of
indebtedness outstanding under our Term Facility and $0.2 million of finance lease obligations. We also had $250.0
million of undrawn capacity under our Revolving Facilities. Beginning with the fiscal year ended December 31, 2025, our
Term Loan requires annual prepayments of a portion of “Excess Cash Flow,” subject to specified leverage-based step-
downs, which may limit our ability to allocate cash to strategic investments, working capital or other corporate purposes.
See Note 18 - Debt to our consolidated financial statements in this Annual Report for more information on the Company’s
Credit Agreement.
Our substantial indebtedness, combined with our other financial obligations and contractual commitments, could have
important consequences, including to:
•increase our vulnerability to adverse economic and industry conditions, which could place us at a competitive
disadvantage compared to our competitors that have relatively less indebtedness;
•require us to dedicate a substantial portion of our cash flows from operations to payments on our indebtedness,
thereby reducing the availability of our cash flows to fund working capital, capital expenditures, acquisitions,
research and development efforts, growth in international markets and other general corporate needs;
•limit our flexibility in planning for, or reacting to, changes in our business and the industry in which we operate;
and
•limit our ability to borrow additional funds, if needed, for working capital, capital expenditures, acquisitions,
product development and other corporate purposes.
We require a significant amount of cash to service our indebtedness. Our ability to generate cash depends on many
factors beyond our control, and we may be unable to generate sufficient cash flow to service our debt obligations.
Our ability to make scheduled payments of principal and interest with respect to our indebtedness will depend on our
ability to generate cash and on future financial results. This, to a certain extent, is subject to general economic, financial,
competitive, legislative, regulatory and other factors that are beyond our control.
There can be no assurances that our business will generate sufficient cash flow from operations to enable us to pay our
indebtedness when due. In such circumstances, we may need to refinance all or a portion of our indebtedness on or before
maturity, sell material assets or operations, delay capital expenditures, or raise additional debt or equity capital. Our ability
to refinance our debt will depend on the condition of the capital markets and our financial condition at that time. Any
refinancing of our debt could be at higher interest rates and may require us to comply with more onerous covenants, which
could further restrict our business operations.
Interest rate fluctuations could have an adverse effect on our financial results.
We are exposed to market risk associated with adverse movements in interest rates. Specifically, we are primarily
exposed to changes in earnings and related cash flows on our variable interest rate debt obligations, including obligations
outstanding under our Term Facility and Revolving Facilities. As a result, increases in interest rates would increase the cost
of servicing our debt. Each 1% increase in underlying base interest rates on our variable-rate debt would increase our
annual forecasted interest expense by approximately $2.3 million on the non-hedged portion of our borrowings based on
balances as of December 31, 2025. See Note 18 - Debt for more information on the Company’s debt and financing
arrangements. The impact of rising interest rates could be more significant for us than it would be for some other
companies because of our substantial indebtedness.
38
The agreements governing our indebtedness contain restrictions and limitations that could restrict our current and
future operations, particularly our ability to respond to change or pursue our business strategies.
On August 19, 2024, our subsidiary, Alliance Laundry Systems LLC (“Alliance Laundry Systems” or the “U.S.
Borrower”), entered into a Credit Agreement (as amended on February 20, 2025 and as further amended on August 21,
2025, the “Credit Agreement”) with Alliance Laundry Holdings LLC (“Holdings”), Alliance Laundry (Thailand) Company
Limited (the “Thai Borrower” and, together with the U.S. Borrower, the “Borrowers”), Citibank, N.A., as administrative
agent, and the lenders and issuing banks from time to time party thereto. The Credit Agreement provides for senior secured
credit facilities consisting of (1) a term loan facility in an aggregate principal amount of $2,075.0 million (the “Term
Facility,” and the loans thereunder, the “Term Loans”), (2) a revolving credit facility with aggregate commitments of
$225.0 million (the “Primary Revolving Facility,” and the loans thereunder, “Primary Revolving Facility Loans”),
including a $102.2 million letter of credit sub-facility, and (3) a revolving credit facility with aggregate commitments of
$25.0 million, all of which is available for letters of credit. The Credit Agreement contains a number of restrictive
covenants that impose restrictions on our ability to pursue our business plans and activities and that could limit our ability
to plan for or react to market conditions, meet capital needs or make acquisitions, including, among other things,
restrictions on our ability, to:
•incur or guarantee additional indebtedness;
•create or maintain liens;
•pay dividends or make other distributions in respect of equity interests, or redeem, purchase or retire equity
interests;
•make payments in respect of subordinated debt;
•make investments, loans, advances, guarantees and acquisitions;
•consolidate, merge, liquidate or dissolve;
•dispose of assets;
•enter into transactions with affiliates; and
•materially alter the conduct of our business.
The Revolving Facilities are also subject to a financial maintenance covenant that imposes on us a maximum first lien
secured net leverage ratio in the event usage under the Revolving Facilities exceeds a specified threshold. Our ability to
comply with this financial maintenance covenant may be affected by events beyond our control, including prevailing and
future economic, financial and industry conditions, and we cannot provide assurance that we will continue to comply with
this covenant in the future. If we are unable to comply with the financial maintenance covenant, we may have to request an
amendment or waiver from lenders under the Revolving Facilities. There is no assurance that we would be able to obtain
any such amendment or waiver, either on commercially reasonable terms or at all.
Our failure to comply with these covenants and restrictions could result in an event of default which, if not waived,
could result in the lenders terminating our ability to make further borrowings under the Revolving Facilities and
accelerating our outstanding indebtedness under the Term Facility, the Revolving Facilities and any other material
indebtedness. In the event of such acceleration, we may not have sufficient assets to satisfy our repayment obligations,
which could cause us to become bankrupt or insolvent. Additionally, if we are unable to satisfy our repayment obligations,
the lenders under the Term Facility and the Revolving Facilities will also have the right to proceed against the collateral
that secures those borrowings, which could have serious adverse consequences to our business, financial condition, results
of operations and cash flows. See “Part II, Item 7. Management’s Discussion and Analysis of Financial Condition and
Results of Operations,” in this Annual Report for further information regarding our Term Facility and Revolving Facilities.
The repayment obligations under our outstanding debt may also have the effect of discouraging, delaying or preventing
a takeover of our company.
Despite our current indebtedness levels, we and our subsidiaries may incur significant additional indebtedness in the
future. This could further exacerbate the risks associated with our substantial financial leverage.
Although the Credit Agreement contains restrictions on the incurrence of additional indebtedness, these restrictions are
subject to several qualifications and exceptions, and the additional indebtedness incurred in compliance with these
39
restrictions could be substantial. If new debt is added to our current debt levels, the related risks that we now face could
intensify.
We may have future capital needs and may not be able to obtain additional financing on acceptable terms.
Although we believe that our current cash position and the additional funding available under our Revolving Facilities
is sufficient for our current operations, we may require additional financing if our cash flow from operations is less than we
anticipate, if our cash requirements are more than we expect, if we intend to finance acquisitions or if our operating plan
changes because of factors currently unknown to us. In addition, we may seek additional capital due to favorable market
conditions or strategic considerations even if we believe we have sufficient funds for our current or future operating plans.
Our ability to secure additional financing on favorable terms or at all and to satisfy our financial obligations under
indebtedness outstanding from time to time will depend upon our future operating performance and operating cash flows,
the condition of the capital markets, the availability of credit generally, economic conditions and financial, business and
other factors, many of which are beyond our control. Furthermore, if financing is not available when needed, or is available
on unfavorable terms, we may be unable to take advantage of business opportunities or respond to competitive pressures,
any of which could have a material adverse effect on our business, financial condition, results of operations and cash flows.
If we incur additional debt or raise equity through the issuance of additional capital shares, the terms of the debt or capital
shares issued may give the holders rights, preferences and privileges senior to those of holders of our shares of common
stock offered hereby, particularly in the event of liquidation. The terms of the debt may also impose additional and more
stringent restrictions on our operations than we currently have. If we raise funds through the issuance of additional equity,
the percentage ownership of existing stockholders in our company would decline.
Risks Relating to Ownership of Our Common Stock
We may require additional capital to meet our financial obligations and support business growth, and this capital may
not be available on acceptable terms, if at all, and such additional capital and other equity issuances we make may
cause dilution to existing stockholders.
We may need to raise additional funds in the future to finance our operations or acquire complementary businesses.
However, debt or equity financing may not be available to us on acceptable terms, if at all. If we do obtain capital in future
offerings on a per-share basis that is less than the current price per share, the value of the price per share of your common
stock will likely be reduced. In addition, if we issue additional equity securities in a future offering and you do not
participate in such offering, there will effectively be dilution in your percentage ownership interest in the Company.
Further, we may in the future grant stock options and other awards to certain of our current or future officers, directors,
employees and consultants under additional plans or individual agreements. The grant, exercise, vesting or settlement of
these awards, as applicable, will have the effect of diluting your ownership interests in the Company. We may also issue
additional equity securities in connection with other types of transactions, including shares issued as part of the purchase
price for acquisitions of assets or other companies from time to time or in connection with strategic partnerships or joint
ventures, or as incentives to management or other providers of resources to us. Such additional issuances are likely to have
the same dilutive effect.
Our stock price could be extremely volatile and, as a result, you may not be able to resell your shares at or above the
price you paid for them, and you could lose all or part of your investment as a result.
The market price of our common stock may be highly volatile, and investors in our common stock may experience a
decrease, which could be substantial, in the value of their stock, including decreases unrelated to our operating performance
or prospects, and could lose all or part of their investment. The price of our common stock could be subject to wide
fluctuations in response to a number of factors, including those described elsewhere in this Annual Report and others such
as:
•variations in our operating performance and the performance of our competitors;
•actual or anticipated fluctuations in our quarterly or annual operating results;
•publication of research reports by securities analysts about us, our competitors or our industry;
•our failure or the failure of our competitors to meet analysts’ projections or guidance that we or our competitors
may give to the market;
•additions or departures of key personnel;
40
•strategic decisions by us or our competitors, such as acquisitions, divestitures, spin-offs, joint ventures, strategic
investments or changes in business strategy;
•an increase in our indebtedness or the interest rates applicable to our indebtedness;
•future sales of our common stock or other securities;
•the passage of legislation or other regulatory developments affecting us or our industry;
•changes in legislation, regulation and government policy as a result of the U.S. presidential and congressional
elections;
•speculation in the press or investment community;
•changes in accounting principles;
•terrorist acts, acts of war or periods of widespread civil unrest;
•natural or man-made disasters and other calamities;
•changes in general market and economic conditions in our industry or the economy as a whole; and
•the other factors described in this “Item 1A. Risk Factors” and the section titled “Cautionary Note Regarding
Forward-Looking Statements.”
Additionally, in the past, securities class action litigation has often been initiated against companies following periods
of volatility in their stock price. This type of litigation could result in substantial costs and divert our management’s
attention and resources, and could also require us to make substantial payments to satisfy judgments or to settle litigation.
Future sales, or the perception of future sales, by us or our existing stockholders of a substantial amount of our
common stock in the public market could cause the price of our common stock to fall.
In connection with our IPO, each of our executive officers and directors, certain senior employees that are not
executive officers and certain former directors, and BDTBH, the funding vehicle through which our principal stockholder
and certain other institutional investors (the “Minority Investment Institutional Co-Investors”) hold their respective
interests, which collectively owned approximately 99% of our outstanding common stock prior to our IPO, entered into a
lock-up agreement with the representatives of the underwriters in our IPO, which regulates their sales of our common stock
until April 6, 2026, subject to certain exceptions. The representatives may, in their sole discretion, release all or some
portion of the shares subject to lock-up agreements at any time and for any reason.
In addition to the lock-up agreements described above, certain of our current and former employees hold equity awards
or shares of our common stock that are subject to equity award or purchase agreements containing market standoff or lock-
up provisions, which covers the balance of all of our outstanding common stock owned prior to IPO. These provisions
generally prohibit the sale or transfer of any shares of our common stock acquired pursuant to such agreements, whether or
not any such awards have been exercised and the shares are held outright, until April 6, 2026. We have agreed to enforce
all such market standoff or lock-up restrictions and not to amend or waive any such provisions until April 6, 2026 without
first obtaining the written consent of the representatives, provided that we may release shares from such restrictions to the
extent such shares would be entitled to release under the lock-up agreements described above.
Sales of substantial amounts of our common stock in the public market in the future, the perception that such sales will
occur, or early release of these lock-up agreements could adversely affect the market price of our common stock and make
it difficult for us to raise funds through securities offerings in the future.
We currently do not intend to declare dividends on our common stock in the foreseeable future and, as a result, your
only opportunity to achieve a return on your investment is if the price of our common stock appreciates.
We currently do not expect to declare any dividends on our common stock in the foreseeable future. Instead, we
anticipate that all of our earnings in the foreseeable future will be used to support our operations, to finance the growth and
development of our business and to pay down debt. Any determination to declare or pay dividends in the future will be at
the discretion of our board of directors, subject to applicable laws and dependent upon a number of factors, including our
earnings, capital requirements and overall financial conditions. In addition, because we are a holding company, our ability
to pay dividends on our common stock is dependent upon cash dividends, distributions and other transfers from our
subsidiaries. The agreements governing certain indebtedness of our subsidiaries also impose restrictions on our ability to
41
pay dividends, and we may be further restricted from doing so by the terms of any future debt or preferred securities.
Accordingly, your only opportunity to achieve a return on your investment in the Company may be if the market price of
our common stock appreciates and you sell your common stock at a profit. The market price for our common stock may
never exceed, and may fall below, the price that you pay for such common stock.
If securities or industry analysts do not publish research or publish inaccurate or unfavorable research about us, our
business or our market, or if they change their recommendation regarding our common stock adversely, the trading
price and trading volume of our common stock could decline.
The trading market for our common stock will depend in part on the research and reports that securities or industry
analysts publish about us, our business, our market or our competitors. If any analysts cease coverage of us unexpectedly,
the price and trading volume of our common stock likely would be negatively impacted. If securities or industry analysts
who cover us downgrade our common stock or publish inaccurate or unfavorable research about us, the trading price of our
common stock would likely decline. If analysts publish target prices for our common stock that are below the then-current
public price of our common stock, it could cause the trading price of our common stock to decline significantly.
Our principal stockholder currently controls the direction of our business. Our principal stockholder’s interests in our
business may conflict with the interests of our other stockholders.
Our principal stockholder currently owns 71.3% of our outstanding common stock. In connection with our IPO, we
entered into a stockholders agreement with our principal stockholder to govern the relationship between us and our
principal stockholder, including matters related to our corporate governance, rights to designate directors and additional
matters. The stockholders agreement provides that, so long as our principal stockholder beneficially owns at least 40% of
the aggregate outstanding shares of our common stock, our principal stockholder may designate a majority of the nominees
for election to our board of directors; so long as our principal stockholder beneficially owns at least 10% but less than 40%
of the aggregate outstanding shares of our common stock, our principal stockholder will continue to retain certain
designation rights under the Stockholders Agreement proportionate to its percentage ownership in our common stock. In
addition, so long as our principal stockholder beneficially owns at least 25% of the aggregate outstanding shares of our
common stock, our principal stockholder will have the right to appoint and remove the chairman of our board of directors
and the lead independent director, if any. This concentration of ownership may have the effect of deterring, delaying or
preventing a change of control of the Company, could deprive our stockholders of an opportunity to receive a premium for
their common stock as part of a sale of the Company and might ultimately affect the market price of our common stock.
We have opted out of Section 203 of the DGCL, which prohibits a publicly held Delaware corporation from engaging
in a business combination transaction with an interested stockholder for a period of three years after the interested
stockholder became such unless the transaction fits within an applicable exemption, such as board approval of the business
combination or the transaction which resulted in such stockholder becoming an interested stockholder. Therefore, after the
180-day lock-up period expires, our principal stockholder will be able to transfer control of us to a third party by
transferring their shares of our common stock (subject to certain restrictions and limitations), which would not require the
approval of our board of directors or our other stockholders.
Our principal stockholder may also have interests that differ from yours. For example, our principal stockholder, and
the members of our board of directors who are affiliated with our principal stockholder, by the terms of our certificate of
incorporation, will not be required to offer us any corporate opportunity of which it becomes aware and can take any such
corporate opportunity for itself or offer it to other companies in which it has an investment. We, by the terms of our
certificate of incorporation, will expressly renounce any interest or expectancy in any such corporate opportunity to the
extent permitted under applicable law, even if the opportunity is one that we or our subsidiaries might reasonably have
pursued or had the ability or desire to pursue if granted the opportunity to do so. In addition, our principal stockholder is in
the business of making investments in companies and may, from time to time, acquire and hold interests in businesses that
directly or indirectly compete with our business, as well as in businesses that are significant existing or potential customers.
We are a “controlled company” within the meaning of the corporate governance standards of the NYSE. As a result, we
qualify for, and may in the future rely on, exemptions from certain corporate governance requirements. You do not
have the same protections afforded to stockholders of companies that are subject to such requirements.
Our principal stockholder controls a majority of the voting power of shares eligible to vote in the election of our
directors. Because more than 50% of the voting power in the election of our directors will be held by an individual, group
or another company, we are a “controlled company” within the meaning of the corporate governance standards of the
42
NYSE. As a controlled company, we may elect in the future not to comply with certain corporate governance requirements,
including the requirements that, within one year of the date of the listing of our common stock:
•our board of directors be composed of a majority of “independent directors,” as defined under the NYSE’s rules;
•the compensation of our executive officers be determined, or recommended to our board of directors for
determination, by a compensation committee comprised solely of independent directors; and
•our director nominees be selected, or recommended for our board of director’s selection, by a nominating and
governance committee comprised solely of independent directors.
We do not intend to rely on these exemptions at this time but may decide to do so in the future. Accordingly, you will
not have the same protections afforded to stockholders of companies that are subject to all of the corporate governance
requirements of the NYSE.
The requirements of being a public company may strain our resources, increase our costs, divert management’s
attention, and affect our ability to attract and retain executive management and qualified board members.
As a public company, we incur significant legal, accounting, reporting and other expenses, including costs associated
with public company reporting requirements and costs of recruiting and retaining non-executive directors. We also incur
costs associated with compliance with the Sarbanes-Oxley Act, the Dodd-Frank Wall Street Reform and Consumer
Protection Act and related rules implemented by the SEC and the NYSE listing rules. The expenses incurred by public
companies generally for reporting and corporate governance purposes have been increasing. Our management will need to
devote a substantial amount of time to ensure that we comply with all of these requirements.
In addition, changing laws, regulations and standards relating to corporate governance and public disclosure are
creating uncertainty for public companies, increasing legal and financial compliance costs and making some activities more
time consuming. These laws, regulations and standards are subject to varying interpretations, in many cases due to their
lack of specificity, and, as a result, their application in practice may evolve over time as new guidance is provided by
regulatory and governing bodies. This could result in continuing uncertainty regarding compliance matters and higher costs
necessitated by ongoing revisions to disclosure and governance practices. We intend to continue to invest resources to
comply with evolving laws, regulations and standards, and this investment may result in increased general and
administrative expenses and a diversion of management’s time and attention from revenue-generating activities to
compliance activities. If our efforts to comply with new laws, regulations and standards differ from the activities intended
by regulatory or governing bodies due to ambiguities related to practice, regulatory authorities may initiate legal
proceedings against us, which could have an adverse effect on our business, financial condition, results of operations and
cash flows.
These laws and regulations also could make it more difficult or costly for us to obtain certain types of insurance,
including director and officer liability insurance, and we may be forced to accept reduced policy limits and coverage or
incur substantially higher costs to obtain the same or similar coverage. These laws and regulations could also make it more
difficult to attract and retain qualified persons to serve on our board of directors, our board committees or as executive
officers. Furthermore, if we are unable to satisfy our obligations as a public company, we could be subject to delisting of
our common stock, fines, sanctions and other regulatory action and potentially civil litigation.
Failure to comply with the requirements to design, implement and maintain effective internal controls over financial
reporting in accordance with Section 404 of the Sarbanes-Oxley Act could materially and adversely affect us.
As a public company, we have significant requirements for enhanced financial reporting and internal controls. The
process of designing and implementing effective internal controls is a continuous effort that requires us to anticipate and
react to changes in our business and the economic and regulatory environments and to expend significant resources to
maintain a system of internal controls that is adequate to satisfy our reporting obligations as a public company. Testing and
maintaining internal controls may divert our management’s attention from other matters that are important to our business.
If we are unable to establish or maintain appropriate internal financial reporting controls and procedures, it could cause
us to fail to meet our reporting obligations on a timely basis, result in material misstatements in our consolidated financial
statements and harm our operating results. Although we are required to disclose changes that have materially affected, or
are reasonably likely to materially affect, our internal control over financial reporting on a quarterly basis, we are not
required to make our first annual assessment of our internal control over financial reporting pursuant to Section 404 of the
Sarbanes-Oxley Act (“Section 404”) until our second annual report on Form 10-K. This assessment will need to include
disclosure of any material weaknesses identified by our management in an internal control over financial reporting. In
addition, our independent registered public accounting firm will be required to formally attest to the effectiveness of our
43
internal control over financial reporting pursuant to Section 404(b) commencing the year following our first annual report
required to be filed with the SEC.
In connection with the implementation of the necessary procedures and practices related to internal control over
financial reporting, we may identify deficiencies that we may not be able to remediate in time to meet the deadline imposed
by the Sarbanes-Oxley Act for compliance with the requirements of Section 404. In addition, we may encounter problems
or delays in completing the remediation of any deficiencies identified by us or our independent registered public
accounting firm in connection with the issuance of their attestation report.
We previously identified a material weakness in our internal control over financial reporting. We may not be able to
conclude on an ongoing basis that we have effective internal control over financial reporting in accordance with Section
404 or our independent registered public accounting firm may not issue an unqualified opinion. If either we are unable to
conclude that we have effective internal control over financial reporting or our independent registered public accounting
firm is unable to provide us with an unqualified report, investors could lose confidence in our reported financial
information, which could cause the price of our common stock to decline, and we may be subject to investigation or
sanctions by the SEC.
Risks Relating to our Organizational Structure
Some provisions of Delaware law, our Stockholders Agreement and our amended and restated certificate of
incorporation and bylaws may deter third parties from acquiring us and diminish the value of our common stock.
Our Stockholders Agreement and our amended and restated certificate of incorporation and bylaws provide for, among
other things:
•division of our board of directors into three classes of directors, with each class as equal in number as possible,
serving staggered three-year terms;
•a prohibition on business combinations with interested stockholders (other than our principal stockholder and its
transferees) similar to that set forth in Section 203 of the DGCL;
•so long as our principal stockholder beneficially owns at least 40% of the aggregate outstanding shares of our
common stock, our principal stockholder may designate a majority of the nominees for election to our board of
directors;
•so long as our principal stockholder beneficially owns at least 25% of the aggregate outstanding shares of our
common stock, our principal stockholder will have the right to appoint and remove the chairman of our board of
directors and the lead independent director, if any;
•following the time when our principal stockholder no longer maintains beneficial ownership of at least a majority
of the aggregate outstanding shares of our common stock, there will be:
◦restrictions on the ability of our stockholders to call a special meeting and the business that can be conducted
at such meeting or to act by written consent; and
◦removal of directors by the affirmative vote of holders of 66 2/3% of the total voting power of our outstanding
shares of common stock, voting together as a single class, and, for so long as our board of directors remains
classified, only for cause;
•following the time when our principal stockholder no longer maintains beneficial ownership of at least 40% of the
aggregate outstanding shares of our common stock, there will be supermajority approval requirements for
amending or repealing certain provisions in the certificate of incorporation and bylaws;
•our ability to issue additional shares of common stock and to issue preferred stock with terms that our board of
directors may determine, in each case without stockholder approval (other than as specified in our certificate of
incorporation);
•the absence of cumulative voting in the election of directors; and
•advance notice requirements for stockholder proposals and nominations.
These provisions in our Stockholders Agreement and our amended and restated certificate of incorporation and bylaws
may discourage, delay or prevent a transaction involving a change in control of our company that is in the best interest of
44
our minority stockholders. Even in the absence of a takeover attempt, the existence of these provisions may adversely
affect the prevailing market price of our common stock if they are viewed as discouraging future takeover attempts. These
provisions could also make it more difficult for stockholders to nominate directors for election to our board of directors and
take other corporate actions.
The provision of our amended and restated certificate of incorporation requiring exclusive forum in certain courts in
the State of Delaware or the federal district courts of the United States for certain types of lawsuits may have the effect
of discouraging lawsuits against our directors and officers.
Our amended and restated certificate of incorporation provides that, unless we, in writing, select or consent to the
selection of an alternative forum, all complaints asserting any internal corporate claims (defined as claims, including claims
in the right of the Company: (i) that are based upon a violation of a duty owed to us or our stockholders by a current or
former director, officer or other employee in such capacity; or (ii) as to which the DGCL confers jurisdiction upon the
Court of Chancery), to the fullest extent permitted by law, and subject to applicable jurisdictional requirements, shall be
brought solely in the Court of Chancery of the State of Delaware (or, if the Court of Chancery does not have, or declines to
accept, subject matter jurisdiction, another state court or a federal court located within the State of Delaware). Additionally,
unless we consent in writing to the selection of an alternative forum, the federal district courts of the United States shall be
the exclusive forum for the resolution of any complaint asserting a cause of action arising under the Securities Act. Our
choice-of-forum provision does not apply to suits brought to enforce any liability or duty created by the Securities
Exchange Act of 1934, as amended (the “Exchange Act”). Any person or entity purchasing or otherwise acquiring or
holding any interest in our common stock shall be deemed to have notice of and to have consented to the forum selection
provisions described in our amended and restated certificate of incorporation. Although we believe these exclusive forum
provisions benefit us by providing increased consistency in the application of Delaware law and federal securities laws in
the types of lawsuits to which each applies, the exclusive forum provisions may limit a stockholder’s ability to bring a
claim in a judicial forum that it finds favorable for disputes with us or any of our directors, officers, or stockholders, which
may discourage lawsuits with respect to such claims. Our stockholders will not be deemed to have waived our compliance
with the federal securities laws and the rules and regulations thereunder as a result of our exclusive forum provisions.
Further, in the event a court finds either exclusive forum provision contained in our certificate of incorporation to be
unenforceable or inapplicable in an action, we may incur additional costs associated with resolving such action in other
jurisdictions, which could harm our business, financial conditions, results of operations and cash flows.
Item 1B. Unresolved Staff Comments
None.
Item 1C. Cybersecurity
safeguard our information systems and protect the confidentiality, integrity and availability of our data.
Risk management and strategy
In the ordinary course of our business, we and our third-party service providers collect, maintain and transmit sensitive
data, including personal information from customers, employees and business partners, through our equipment financing
program and Speed Queen and Huebsch apps. The secure maintenance of this information is critical to our business and
reputation. In addition, we are heavily dependent on the functioning of our information technology infrastructure to carry
out our both internal and external operations. While we have adopted administrative, technical and physical safeguards to
protect such systems and data, our systems and those of third-party service providers may be vulnerable to a cyber-attack.
processes include frameworks to respond to and assess internal and external threats to the security, confidentiality, and
integrity of our data and information systems, along with other material risks to our operations, which we review with our
technology leadership and information security steering committee, and Audit Committee at least twice annually or
Our technology department is tasked with evaluating and addressing cybersecurity risks in alignment with our business
objectives and operational needs. We have processes to detect potential vulnerabilities and anomalies through technical
safeguards. As part of our risk management process, we conduct regular security audits to assess and respond to internal
and external security threats and engage outside providers to conduct periodic internal and external penetration testing.
45
We rely on third parties , including cloud vendors and consultants, for various business functions. Many of our third-
party service providers have access to our information systems and data, and we rely on such third parties for the
continuous operation of our business operations. We oversee third-party service providers by conducting vendor diligence.
Vendors are generally assessed for risk based on the nature of their service, access to data and systems and supply chain
risk and, based on that assessment, we conduct diligence that may include completing security questionnaires, onsite
evaluation, and scans or other technical evaluations.
Governance
Committee has primary responsibility for cybersecurity oversight, including reviewing management’s assessments of
with management and the Company’s auditors, the adequacy and effectiveness of the Company’s cybersecurity policies.
The Audit Committee, or the Board of Directors as a whole, is briefed on any material cybersecurity incidents that may
information security, including leadership roles at healthcare and global financial institutions. The Director of
operations, facilities, and firmware and software development, the cybersecurity team implements processes to identify,
assess, and manage material risks to our networks, third‑party‑hosted services, communications systems, hardware,
software, and critical data.
penetration testing, threat‑intelligence services, and tabletop exercises to identify and manage risks. The Director of
Cybersecurity reports to the Audit Committee at least twice per year regarding risk assessments, control decisions,
service‑provider oversight, testing results, security incidents, response activities, and recommended policy and procedure
updates.
threats, including cybersecurity threats, could pose risks to the security of our systems and networks, as well as the
confidentiality, availability and integrity of our data. Cyberattacks are expected to accelerate on a global basis in frequency
and magnitude as threat actors are becoming increasingly sophisticated in using techniques and tools—including artificial
intelligence (“AI”)—that circumvent security controls, evade detection and remove forensic evidence. Any material
incidents could cause us to experience financial losses that are either not insured against or not fully covered through any
insurance maintained by us and increased expenses related to addressing or mitigating the risks associated with any such
material incidents. Despite our efforts to ensure the integrity of our systems, as cyber threats evolve and become more
difficult to detect and successfully defend against, one or more cyber threats might defeat the measures that we or our
vendors take to anticipate, detect, avoid or mitigate such threats. For more information, see “Item 1.A Risk Factors - The
protection of our data involves risks regarding security incidents which could damage our reputation, harm our operating
results or result in significant liabilities or other adverse consequences that could have a material and adverse effect on our
Item 2. Properties
Facilities
Headquarters and Office Locations
Our global headquarters is located at 221 Shepard Street, Ripon, Wisconsin 54971. We expect that this approximately
1.7 million square foot corporate complex, of which we own and lease portions, will accommodate our growth plans for the
foreseeable future. In addition to our global headquarters, we lease sales offices across the United States, as well as in
Belgium, China, Brazil, France, Spain, Italy, Germany, Netherlands and the United Arab Emirates. We believe that our
current facilities are adequate to meet our immediate needs and believe that we should be able to renew any of our leases
without an adverse impact on our operations.
46
Manufacturing and Distribution Facilities
We operate manufacturing facilities located in the United States (Ripon and Manitowoc, Wisconsin); Pribor, Czech
Republic; Chonburi, Thailand; and Guangzhou, China with an aggregate footprint of approximately 2.7 million square feet,
including our global headquarters. Our manufacturing operations primarily consist of fabricating, machining, painting,
assembling and finishing operations. We also operate finished goods and service parts distribution centers.
The following is a summary of our principal properties as of December 31, 2025, the majority of which are leased
spaces, including manufacturing, distribution, warehouse and sales office sites.
No. of Facilities | ||||||||
Locations | Manufacturing | Distribution / Sales Offices with Warehouses | Sales / Corporate Offices Only | Warehouses | ||||
United States | ||||||||
Wisconsin | 3 | 1 | 2 | |||||
Florida | 1 | |||||||
Texas | 2 | |||||||
California | 4 | 2 | ||||||
New York | 2 | |||||||
Georgia | 1 | |||||||
Illinois | 1 | 1 | ||||||
Washington | 1 | |||||||
Oregon | 1 | |||||||
Maryland | 1 | 1 | ||||||
Pennsylvania | 1 | |||||||
Utah | 1 | |||||||
Tennessee | 1 | |||||||
Rest of World | ||||||||
China | 1 | 1 | 1 | |||||
Czech Republic | 1 | 1 | ||||||
Thailand | 1 | 1 | ||||||
Brazil | 1 | 2 | ||||||
France | 1 | 1 | ||||||
Germany | 1 | |||||||
Italy | 1 | 1 | ||||||
Netherlands | 1 | |||||||
Spain | 1 | 1 | ||||||
UAE | 1 | |||||||
Belgium | 1 | |||||||
Item 3. Legal Proceedings
From time to time we are a party to various legal proceedings incidental to the conduct of our business. The results of
legal proceedings are inherently unpredictable and uncertain. We are not presently party to any legal proceedings the
resolution of which we believe would have a material adverse effect on our business, prospects, financial condition,
liquidity, results of operations, cash flows or capital levels.
We periodically reexamine our estimates of probable liabilities and any associated expenses and receivables and make
appropriate adjustments to such estimates based on experience and developments in litigation. As a result, the current
estimates of the potential impact on our business, prospects, financial condition, liquidity, results of operation, cash flows
or capital levels for the proceedings and claims described in the notes to our consolidated financial statements could change
in the future.
47
Regardless of the outcome, legal proceedings have the potential to have an adverse impact on us because of defense
and settlement costs, diversion of management resources and other factors. See “Item 1A. Risk Factors—Risks Relating to
Government Regulation and Litigation” for more information on the risk of potential legal proceedings and their associated
costs.
Item 4. Mine Safety Disclosures
Not applicable.
48
Part II
Item 5. Market for Registrant's Common Equity, Related Stockholder Matters and Issuer Purchases of Equity
Securities
Securities Market Information
Our common stock has been listed on the NYSE under the symbol “ALH” since October 9, 2025. Prior to that, there
was no public trading market for our common stock.
Holders of Record
As of March 6, 2026, there were approximately 43 stockholders of record for our common stock. The actual number of
stockholders is greater than this number of record holders, and includes stockholders who are beneficial owners, but whose
shares are held in street name by brokers and other nominees. This number of holders of record also does not include
stockholders whose shares may be held in trust by other entities.
Dividend Policy
We currently intend to retain all available funds and future earnings, if any, to fund the development and expansion of
our business and pay down debt, and we do not anticipate declaring or paying any cash dividends in the near term. The
declaration and payment by us of any future dividends to holders of shares of our common stock will be at the sole
discretion of our Board of Directors and will depend on our financial condition, earnings, cash needs, capital requirements
(including requirements of our subsidiaries), contractual, legal, tax and regulatory restrictions, and any other factors that
our Board of Directors deems relevant in making such a determination. Additionally, we are a holding company and do not
conduct any business operations of our own. As a result, our ability to pay cash dividends on shares of our common stock
is dependent upon cash dividends, distributions and other transfers from our subsidiaries. We may also enter into other
credit agreements or borrowing arrangements in the future that could restrict our ability to declare or pay cash dividends.
49
Stock Performance Graph
The following graph compares the total return to stockholders of our common stock for the period October 9, 2025 to
December 31, 2025, relative to the total return of the following:
•the NYSE Composite Index; and
•the S&P Composite 1500 Household Durables Sub-Industry Index.
The graph assumes that $100 was invested in our common stock, and in the indices noted above, and that all
dividends, if any, were reinvested. No dividends have been declared or paid on our common stock. The stock price
performance shown in the graph is not necessarily indicative of future performance.
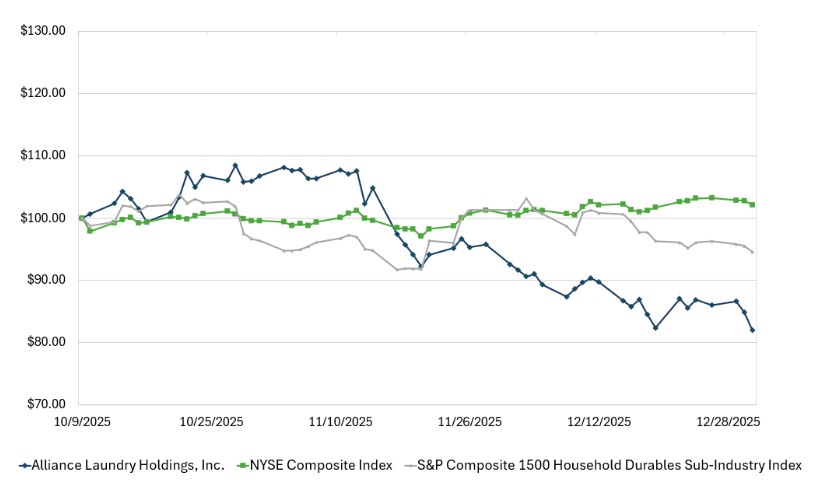
The information above shall not be deemed “soliciting material” or to be “filed” for purposes of Section 18 of the
Exchange Act, or otherwise subject to the liabilities under that section, and shall not be incorporated by reference into any
of our other filings under the Exchange Act, or the Securities Act, regardless of any general incorporation language in those
filings.
Securities Authorized for Issuance Under Equity Compensation Plans
The information required by this item will be set forth in the Proxy Statement and is incorporated into this Annual
Report on Form 10-K by reference.
Recent Sales of Unregistered Securities
We have engaged in the following transactions that were not registered under the Securities Act during the fiscal year
ended December 31, 2025. Share amounts have been adjusted to give effect to a 142-for-1 forward stock split effected on
September 26, 2025.
In August 2025, we sold an aggregate of 36,678 shares of our common stock with an aggregate purchase price of
$500,000 issued pursuant to our 2015 Stock Purchase Plan.
The offers, sales and issuances of the securities described in this Item 15(a) were exempt from registration under the
Securities Act under either Rule 701, in that the transactions were under compensatory benefit plans and contracts relating
to compensation, or under Section 4(a)(2) of the Securities Act, in that the transactions were between an issuer and certain
50
employees and did not involve any public offering within the meaning of Section 4(a)(2). The recipients of such securities
were our employees, directors or consultants. Appropriate legends were affixed to the securities issued in these
transactions.
Issuer Purchases of Equity Securities
None.
Use of Proceeds from Registered Securities
On October 10, 2025, we completed our initial public offering pursuant to which 43,195,120 shares of our common
stock were sold, which includes the issuance and sale of 24,390,243 shares by the Company and the sale by a selling
stockholder of 18,804,877 shares including the full exercise of the underwriters’ option to purchase 5,634,146 additional
shares, at a price to the public of $22.00 per share. The proceeds to the Company from the IPO were approximately $505.7
million, net of underwriting discounts and commissions and estimated offering costs of approximately $30.8 million.
The net proceeds from our initial public offering along with cash on hand were used to repay $525.0 million of our
indebtedness outstanding under the Term Loan on October 17, 2025.
There has been no material change in the intended use of proceeds from our IPO as described in our Registration
Statement on Form S-1 (File No. 333-290217), which became effective on September 30, 2025.
Item 6. [ Reserved ]
Item 7. Management's Discussion and Analysis of Financial Condition and Results of Operations
The following Management’s Discussion and Analysis of Financial Condition and Results of Operations ("MD&A") is
a discussion of our financial condition and results of operations and should be read in conjunction with our audited
historical consolidated financial statements and the accompanying notes elsewhere in this Annual Report. In addition to
historical financial information, the following discussion contains forward-looking statements that reflect our plans,
estimates, and beliefs. Our actual results may differ materially from those discussed in the forward-looking statements as a
result of various factors. You should review the information set forth in “Cautionary Note Regarding Forward-Looking
Statements” and “Part I. Item 1A. Risk Factors.” For purposes of this section, references to the “Company,” “we,” “us,”
and “our” refer to Alliance Laundry Holdings Inc. and its subsidiaries. This discussion includes disclosures that are
shown in rounded amounts. The related percentage disclosures are calculated on unrounded amounts. As such, certain
totals, subtotals, and percentages may not reconcile.
The following discussion and analysis of our financial condition and results of operations includes discussion of
certain non-GAAP financial measures. For a description and reconciliation of the non-GAAP measures discussed in this
section, see “—Non-GAAP Financial Measures and Key Operating Metrics” below.
The following is a discussion and analysis of, and a comparison between, our results of operations for the years ended
December 31, 2025 and 2024. A discussion and analysis of, and a comparison between, our results of operations for the
years ended December 31, 2024 and 2023 can be found in the section entitled, “Management’s Discussion and Analysis of
Financial Condition and Results of Operations” in our final prospectus on Form 424(b)(4) filed with the SEC on October 9,
2025.
Our Business
We are the world’s largest designer and manufacturer of commercial laundry systems, serving a diverse and resilient
range of global end markets. We believe we engineer and produce the highest quality and one of the most reliable
commercial laundry systems in the industry. We leverage our pure play focus on the commercial laundry industry and over
100 years of engineering excellence to drive innovation and design our equipment to deliver outstanding performance in
the most demanding applications. We believe the need for clean laundry is universal and growing, and our premium
machines meet this fundamental human need, all day, every day.
Key Factors Affecting Our Performance
Our results of operations and financial condition have been, and will continue to be, affected by several factors that
present significant opportunities for us but can also pose risks and challenges, including but not limited to those discussed
51
Incumbent Replacement Cycle
Despite the high reliability and durability of our equipment it does have a finite life, and the mission-critical nature of
our estimated eight million unit installed base of equipment, which we calculate assuming a ten-year average useful life of
our products, means our growth and performance has been driven by a consistent and predictable demand for replacement
equipment. The incumbency advantage offered by this significant installed base and our investment in maintaining
industry-leading physical and digital product offerings make us, we believe, well placed to capitalize on global demand and
continue to grow our market share and develop new markets for our products. This global demand is driven by the
commercial demand of our continually improved products, our customers repeatedly choosing our products and the
attractiveness of laundromats as an investment, and changes in customer habits or changes to the economic model,
including changes to operating, real estate and construction costs, the operating environment, or delays in laundromat
construction or increased regulatory or permitting obligations for laundromats, could impact this demand in the future.
Investment Trends in Diversified End-Markets
In addition to replacement demand, our performance is also driven by investment trends in both our developed and
developing end markets. The investment and macro trends impacting the On-Premise, Vended and Commercial In-Home
end-markets rarely move in tandem, and our ability to access all these markets by providing systems to satisfy the many
differences between them has been a key driver to our historical performance and we believe will continue to drive our
performance going forward.
Myriad applications required by the On-Premise end market create investment trends that rarely move in sync.
Whether our products are used to sterilize large volumes of linens in healthcare, wash highly specialized firefighting gear,
launder hotel linens or are applied in any of the many other end-use cases, our ability to provide specific solutions for all of
these applications gives us end market diversification globally. We believe our incumbency in many of these applications
provides a strong platform for future growth in both developed and developing markets, as these markets upgrade their
laundry systems to align to more developed market standards.
The growth of the Vended market, whether in laundromats or communal laundry facilities, is being driven by a
combination of changes to the investment model in mature markets, including the U.S. and Western Europe, and
demographic changes in less mature markets where we are helping create the demand and drive adoption of Vended
laundry applications.
The U.S. and Western European laundromat markets are seeing an acceleration of investment, driven by a shift to
more commercially focused investors who are willing to invest in the latest machines and technology to deliver an
improved customer experience, and which also allows them to more easily operate their multi-site businesses. This is
driving demand for equipment for new laundromat locations, but also accelerating the replacement cycle in existing stores
as owners refurbish them to keep pace with the market trends. We believe our industry leading products and digital
technologies, alongside our in-house financing capability in the U.S., makes our products the most attractive choice for
these investors which has driven and will continue to drive our performance.
There remains significant untapped opportunity for Vended laundry systems across many under-penetrated developing
markets where there is a nascent or non-existent Vended laundry culture. We have a successful track record of expanding
our business in these high-potential geographies, such as in Thailand where we have grown revenue at a compound annual
growth rate of approximately 42% since we began operations there in 2017. We believe Vended laundry market
opportunities are driven by a number of key indicators such as GDP growth, population growth, rising personal incomes,
increasing urbanization, and expanding family sizes—all resulting in evolving lifestyles that demand Vended laundry
solutions. We believe there are many other potential markets that could replicate the success we have already seen in
markets like Thailand, though there are inevitable risks associated with growth in these new markets. For example, we face
risks associated with unforeseen government actions, changing political conditions, fluctuations in currency exchange rates,
increases in inflation, and other risks. See “Part I. Item 1A. Risk Factors.” In these developing markets, our team takes a
“feet on the street” approach to foster the development of the local commercial laundry industry. We believe accessing
these under-penetrated markets will continue to drive our performance alongside our local partners.
Within the Commercial In-Home market, we have benefited from users who are becoming increasingly frustrated with
lower quality residential machines and are looking for a more reliable and durable commercial-grade solution. We have
capitalized on this demand by focusing on our go-to-market strategy of selling through independent retailers and not “Big
Box” stores; we believe this strategy is unique in the industry and delivers the most profitable laundry sale for a retailer.
We also continue to launch product extensions. Together, these efforts have expanded our reach and product range to in-
home customers and we believe there remains continued growth opportunities in this market as these trends continue.
52
Manufacturing and Procurement Excellence and Related Costs
To ensure that the reliability, durability and quality of our machines meet our customers’ expectations, we seek to
achieve manufacturing and procurement excellence, which in turn means our systems may have higher labor and material
costs than our primary competitors. Those high-quality product characteristics require us to run our manufacturing facilities
efficiently, design products, supporting technologies and any new technologies to appropriately balance cost and
performance, and procure materials and components at optimal prices. These activities have been key to our historical
margin expansion and will continue to be drivers of our margins in the future.
While we continue to focus on cost-down initiatives through engineering, manufacturing and procurement
workstreams, we remain exposed to market prices for these costs. We manage the potential risk in these input costs
through, when we deem appropriate, hedging and fixed price or term contracts. This focus on balancing cost with
performance and quality extends to our suppliers where we focus on long-term, mutually beneficial relationships, rather
than short-term cost minimization transactions, resulting in partnerships that help us to navigate any market volatility. For
example, these relationships were particularly valuable as we navigated the COVID-19 pandemic and supply chain issues
that followed, where we saw no significant disruption to our supply of components and materials.
Non-GAAP Financial Measures and Key Operating Metrics
We regularly review non-GAAP measures to evaluate our business, measure our performance and manage our
operations, including identifying trends affecting our business, formulating business plans and making strategic decisions.
We believe that non-GAAP measures provide an additional way of viewing aspects of our operations that, when viewed
together with our GAAP results, provide a more complete understanding of our results of operations and the factors and
trends affecting our business. These non-GAAP financial measures are also used by our management to evaluate financial
results and to plan and forecast future periods. Non-GAAP financial measures should be considered a supplement to, and
not a substitute for, or superior to, the corresponding measures calculated in accordance with GAAP.
Adjusted EBITDA and Adjusted EBITDA Margin
This Annual Report contains certain financial measures, including Adjusted EBITDA and Adjusted EBITDA Margin,
that are not required by, or prepared in accordance with, GAAP. We refer to these measures as “non-GAAP” financial
measures. The use of non-GAAP financial measures should not be construed as an alternative to, or more meaningful than,
the comparable GAAP financial measure. You should not consider Adjusted EBITDA or Adjusted EBITDA Margin either
in isolation or as substitutes for analyzing our results as reported under GAAP. Adjusted EBITDA and Adjusted EBITDA
Margin are presented for supplemental informational purposes only and have limitations as an analytical tool. For example,
Adjusted EBITDA and Adjusted EBITDA Margin exclude certain tax payments that may reduce cash available to us,
exclude non-cash charges for depreciation of property and equipment and amortization of intangible assets, do not reflect
any cash capital expenditure requirements for such assets being depreciated and amortized that may have to be replaced in
the future, do not reflect changes in, or cash requirements for, our working capital needs and do not reflect the interest
income or expense, or the cash requirements necessary to service interest or principal payments, on our debt. You should
be aware that our presentation of these and other non-GAAP financial measures in this Annual Report may not be
comparable to similarly titled measures used by other companies, including our competitors.
Adjusted EBITDA and Adjusted EBITDA Margin, as defined below, are key non-GAAP measures we use to assess
our financial performance. “Adjusted EBITDA” represents net income before provision for income taxes, interest expense,
depreciation and amortization and is further adjusted to exclude certain expenses not representative of our ongoing
operations and other charges not involving cash outlays and “Adjusted EBITDA Margin” represents Adjusted EBITDA
divided by net revenues. Management utilizes Adjusted EBITDA and Adjusted EBITDA Margin as measures of operating
performance. Management believes that these non-GAAP financial measures are useful to investors for period-to-period
comparisons of the Company’s business and in understanding and evaluating the Company’s operating results for the
following reasons:
•Adjusted EBITDA and Adjusted EBITDA Margin are widely used by investors and securities analysts to measure
a company’s operating performance without regard to items such as share-based compensation expense,
depreciation and amortization expense, interest expense, other expense (income), net, and income taxes expense
(benefit) that can vary substantially from company to company depending upon their financing, capital structures
and the method by which assets were acquired; and
•Adjusted EBITDA and Adjusted EBITDA Margin provide consistency and comparability with the Company’s
past financial performance, facilitate period-to-period comparisons of the Company’s primary operating results,
53
and also facilitate comparisons with other peer companies, many of which use similar non-GAAP financial
measures to supplement their GAAP results.
Non-GAAP Reconciliation
The following table presents a reconciliation of net income to Adjusted EBITDA and Adjusted EBITDA Margin for
the periods presented:
For the Year Ended December 31, | |||||
(in thousands except for percentages) | 2025 | 2024 | 2023 | ||
Net income | $101,755 | $98,319 | $88,229 | ||
Provision for income taxes | 36,279 | 25,130 | 16,226 | ||
Interest expense | 150,501 | 132,001 | 123,397 | ||
Depreciation and amortization | 93,701 | 90,169 | 88,704 | ||
EBITDA | 382,236 | 345,619 | 316,556 | ||
Refinancing and debt related costs (1) | 3,679 | 33,217 | — | ||
Share-based compensation (2) | 19,779 | 3,263 | 3,343 | ||
Pension termination costs (3) | — | — | 7,011 | ||
Strategic transaction costs (4) | 5,627 | 5,803 | 1,083 | ||
Foreign exchange losses/(gains) on intercompany loans (5) | 25,152 | (4,654) | 484 | ||
Adjusted EBITDA | 436,473 | 383,248 | 328,477 | ||
Net revenues | $1,709,237 | $1,508,440 | $1,365,154 | ||
Net income margin | 6.0% | 6.5% | 6.5% | ||
Adjusted EBITDA Margin | 25.5% | 25.4% | 24.1% | ||
_____________________
(1)Represents fees in connection with the Credit Agreement and predecessor credit facilities.
(2)Non-cash expenses related to equity awards granted to management.
(3)Expenses related to the termination and settlement of pension obligations, including settlement charges and amortization of net actuarial losses.
(4)Comprised of professional fees, advisory services and other expenses related to the IPO and acquisitions.
(5)Foreign exchange (loss)/gain on intercompany loans where the lender or borrower’s functional currency differs from the loan denomination
currency.
Segment Operating Metrics
Our business is organized into two reportable segments, North America and International. The Company uses Segment
Net Revenues, Segment Adjusted EBITDA and Segment Adjusted EBITDA Margin as its measures of performance. The
Company allocates certain costs including manufacturing variances, customer support expenses and selling and general
expenses which are incurred in our global operations to the reportable segments in determining Segment Adjusted
EBITDA.
Segment Adjusted EBITDA is a performance metric utilized by the Company’s Chief Operating Decision Maker to
allocate resources on a segment basis. We define Segment Adjusted EBITDA as, on a segment basis, net income before
provision for income taxes, interest expense, depreciation and amortization and further adjusted to exclude certain expenses
not representative of our ongoing operations and charges not involving cash outlays. Segment Adjusted EBITDA is a
measure of operating performance of our reportable segments and may not be comparable to similar measures reported by
other companies. See "Note 22 - Segment Information,” to our audited consolidated financial statements included
elsewhere in this Annual Report and “—Segment Results” below.
Components of Results of Operations
Net Revenues
Revenue is primarily generated through the sale of our commercial-grade laundry systems and service parts across our
two geographic segments and into the three end markets of OPL, Vended and Commercial In-Home. In addition to the sale
of equipment, we also generate revenues from our wrap-around customer offerings including equipment servicing, digital
products and customer financing solutions. No single customer accounted for more than 10% of our total revenue in any of
the last three fiscal years.
54
Equipment, Service parts and other
The Company offers a full line of stand-alone laundry washers and dryers and related service parts. These products
range from small residential washers and dryers to large commercial laundry systems. Revenue from equipment and
service part sales is recognized when the Company satisfies a performance obligation by transferring control of a product,
or providing service, to a customer net of any discounts or allowances. Where post-invoice rebates, allowances or sales
incentive programs are offered, the Company estimates and records the cost of this variable consideration at the time of
sale of the related product.
Equipment financing
The Company offers an equipment financing program to end-customers who are primarily laundromat owners to
finance their purchase of new equipment. Typical terms for equipment financing receivables range from two to twelve
years. Interest income is accrued as earned on outstanding balances. Recognition of income is suspended, and previously
recorded accrued interest income is reversed, when it is determined that collection of future income is not probable (after
89 days past due). Fees earned and incremental direct costs incurred upon origination of equipment financing are not
significant.
Costs and Expenses
Cost of Sales
Cost of sales is comprised of the costs of raw materials and component parts, distribution expenses, costs incurred at
the manufacturing plant level and costs of warehousing, including, but not limited to, labor and related fringe benefits,
depreciation, supplies, utilities, property taxes and insurance, as well as costs associated with product warranties, and other
costs of supporting our other wrap-around customer offerings.
Equipment Financing Expenses
Equipment financing expenses are made up of the interest cost and fees related to our Asset Backed Equipment
Facility, alongside the operational costs, including but not limited to, headcount and systems expenses related to
administering the equipment finance program.
Gross Profit
Gross profit is determined by subtracting cost of sales and equipment financing expenses from net revenues.
Selling, general and administrative expenses
Our selling expenses consist of expenses related to selling our products and services to customers through our global
sales organization including the salaries of our direct sales team. General and Administrative expenses include the cost of
our global, ‘24x7’ engineering and innovation teams as well as the costs required to support the administration of the
business such as finance, accounting, information technology, human resources, legal, general management and
amortization related to the BDTCP Transaction.
Operating income
Operating income is gross profit less SG&A and Other Costs.
Interest expense, net
The Company incurs interest expense related to servicing of its outstanding obligations under its Credit Agreement as
defined herein. The amortization of debt issuance costs and impact of our interest rate hedging instruments are also
included as a component of periodic interest expense.
Net income
Net income is operating income less interest expense, net, other expenses, net, and provision for income taxes.
Factors Affecting the Comparability of Our Results of Operations
Set forth below is a brief discussion of the key factors impacting the comparability of our results of operations.
55
Public Company Costs
Following the completion of our IPO, we have incurred and expect to continue to incur additional costs associated with
operating as a public company. These costs include additional personnel, legal, consulting, regulatory, insurance,
accounting, investor relations, and other expenses that we did not incur as a private company. The Sarbanes-Oxley Act of
2002, as amended, as well as rules adopted by the SEC and national securities exchanges, require public companies to
implement specified corporate governance practices that are currently inapplicable to us as a private company. These
additional rules and regulations, as well as others associated with being a public company, will increase our legal,
regulatory, financial and insurance costs and will make some other activities more time-consuming and costly.
Refinancing Costs
From time to time the Company enters into new or amended credit agreements or securitization facilities to support its
operations, fund acquisitions, make dividend distributions or for other general corporate purposes. These refinancing
activities and related costs, as well as any capitalized costs and original issue discounts from prior transactions, are
capitalized or expensed in accordance with the debt modification and debt extinguishment accounting guidance. Debt
issuance costs are amortized using the effective interest rate method or straight line when straight line approximates the
effective interest rate method.
In February 2025, the Company finalized an amendment to our Credit Agreement, which reduced the applicable
margin on the Term Loan to 2.75% and Revolving Credit Facility ("RCF") to 2.50%. The Company incurred fees of $1.0
million in connection with an amendment to our Credit Agreement, which were expensed and included in Other expenses,
net in the Consolidated Statement of Comprehensive Income.
In August 2025, the Company finalized an amendment to our Credit Agreement, which reduced the applicable margin
on the Term Loan to 2.25% and RCF to 2.25%. The Company incurred fees of $1.3 million in connection with an
amendment to our Credit Agreement, which were expensed and included in Other expenses, net in the Consolidated
Statement of Comprehensive Income.
In August 2024, the Company incurred fees of $32.8 million in connection with the execution of the Credit
Agreement. Of these fees, $30.4 million was expensed and included in Other expenses, net and Other expenses, net -
related parties in the consolidated statements of comprehensive income. The remaining $2.4 million related to the
Revolving Facilities and was capitalized and included in the Other long-term assets line of the consolidated balance sheets.
The Company also recorded $10.4 million of original issuance discount in 2024 related to the Credit Agreement, which is
included in the Long-term debt, net line of the consolidated balance sheets. Additionally, the Company wrote off a portion
of the unamortized debt issuance costs and original issuance discounts related to the prior credit agreement, resulting in
expense of $2.8 million recorded in Other expenses, net in the consolidated statements of comprehensive income.
Presentation of Financial Information
Alliance Laundry Holdings Inc. is a holding company with no business operations or assets other than the capital stock
of its direct and indirect subsidiaries, including those of Alliance Laundry Holdings LLC and Alliance Laundry Systems
LLC. Alliance Laundry Systems LLC, a direct, wholly owned subsidiary of Alliance Laundry Holdings LLC, which is a
direct, wholly owned subsidiary of Alliance Laundry Holdings Inc., is the U.S. Borrower under the Credit Agreement and
the Originator and Servicer under the Asset Backed Equipment Facility and the Asset Backed Trade Receivables Facility,
each as defined below.
56
Results of Operations
For the Year Ended December 31, 2025 v. Year Ended December 31, 2024
The following table sets forth our results of operations for the periods indicated:
(in thousands) | December 31, 2025 | December 31, 2024 | |
Net revenues: | |||
Equipment, service parts and other | $1,659,680 | $1,459,746 | |
Equipment financing | 49,557 | 48,694 | |
Net revenues | 1,709,237 | 1,508,440 | |
Costs and expenses: | |||
Cost of sales | 1,028,073 | 914,655 | |
Cost of sales - related parties | 7,322 | 6,218 | |
Equipment financing expenses | 31,738 | 36,316 | |
Gross profit | 642,104 | 551,251 | |
Selling, general, and administrative expenses | 324,458 | 266,444 | |
Selling, general, and administrative expenses - related parties | 280 | 300 | |
Other costs | — | 494 | |
Total operating expenses | 324,738 | 267,238 | |
Operating income | 317,366 | 284,013 | |
Interest expense, net | 150,501 | 132,001 | |
Other expenses, net | 28,831 | 23,376 | |
Other expenses, net - related parties | — | 5,187 | |
Income before taxes | 138,034 | 123,449 | |
Provision for income taxes | 36,279 | 25,130 | |
Net income | $101,755 | $98,319 |
Net Revenues
Net revenues for the year ended December 31, 2025 increased $200.8 million, or 13%, to $1,709.2 million from
$1,508.4 million for the year ended December 31, 2024. Equipment revenue increased $178.8 million, or 14%, year over
year, primarily driven by volume growth across our reportable segments and all three end markets and modest price
increases. Service parts revenue increased year over year $18.7 million, or 12%. Other revenues increased $2.4 million, or
6%, primarily due to increased field service revenue. Equipment financing revenue increased $0.9 million, or 2%, driven
by the growth of the loan base, partially offset by lower interest income on floating loan rates decreasing alongside the
prime rate.
Net revenues increased $159.8 million in North America, mainly driven by strong demand across all end markets, with
particularly strong performance in Vended, an increase of 11%, and Commercial In-Home, an increase of 26%, end
markets. International segment net revenues increased by $41.0 million due to strong performance in Europe, an increase of
18%, and in Asia Pacific, an increase of 10%, where the expanding Vended end market is driving growth.
Gross profit
Gross profit for the year ended December 31, 2025 increased $90.9 million, or 16%, to $642.1 million from $551.3
million for the year ended December 31, 2024. Gross profit as a percentage of net revenues was 38% for the year ended
December 31, 2025 as compared to 37% for the year ended December 31, 2024. The increase in gross profit as a
percentage of revenue was primarily driven by our continued focus on manufacturing and procurement excellence, and the
benefits of higher production volumes and modest price increases, net of increased input costs including tariff related
expenses.
57
Selling, general, and administrative expenses (“SG&A”)
Selling, general, and administrative expenses for the year ended December 31, 2025 increased $58.0 million, to $324.7
million from $266.7 million for the year ended December 31, 2024. Selling, general, and administrative expenses as a
percentage of net revenues was 19% for the year ended December 31, 2025 as compared to 18% for the year ended
December 31, 2024. Included within Selling, general, and administrative expenses is $42.9 million and $44.6 million
related to non-cash depreciation and amortization of assets, which represents the portion of assets that had increases to their
historical basis as a result of purchase accounting related to the BDTCP Transaction for the years ended December 31,
2025 and 2024, respectively. The increase in Selling, general and administrative expenses is primarily due to investment in
physical and digital product development, increased Information Technology expenses to support systems and security,
acquisition of distributors, public company support costs, additional headcount, expense recognized for performance-based
options as the awards fully vested upon the IPO, and selling expenses driven by higher sales volume and profitability.
Interest expense, net
Interest expense, net for the year ended December 31, 2025 increased $18.5 million to $150.5 million from $132.0
million for the year ended December 31, 2024. The increase in interest expense was primarily attributable to the higher
debt balance following the August 2024 refinancing referenced elsewhere in this MD&A.
Other expenses, net
Other expenses, net for the year ended December 31, 2025 were $28.8 million compared to $28.6 million for the year
ended December 31, 2024. Other expenses, net for the year ended December 31, 2025 were comprised of $25.2 million
foreign exchange losses on intercompany loans where the lender or borrower’s functional currency differs from the loan
denomination currency and $3.7 million associated with refinancing of the Credit Agreement. See Note 18 - Debt to our
audited consolidated financial statements included elsewhere in this Annual Report for a discussion of the Credit
Agreement. Other expenses, net for the year ended December 31, 2024, were comprised of $33.2 million associated with
the entry into the Credit Agreement partially offset by $4.7 million foreign exchange gains on intercompany loans where
the lender or borrower’s functional currency differs from the loan denomination currency.
Provision for Income Taxes
The effective income tax rate was 26.3% for the year ended December 31, 2025, as compared to 20.4% for the year
ended December 31, 2024. As a result of the IPO, the Company is now subject to Internal Revenue Code section 162(m),
Limitation on Officers' Compensation, which resulted in a discrete non-cash charge of $5.2 million, which was partially
offset by a $3.1 million benefit related to excess tax benefits on share-based payments. Additionally discrete non-cash
charge of $1.7 million was recorded for the establishment of a valuation allowance against certain foreign tax credits that
are expected to expire and not be realized.
Segment Results
Our business is organized into two reportable segments, North America and International.
The Company uses Segment Net revenues, Segment Adjusted EBITDA and Segment Adjusted EBITDA Margin as its
measures of performance. The Company allocates certain costs including manufacturing variances, customer support
expenses and selling and general expenses which are incurred in our global operations to the reportable segments in
determining Segment Adjusted EBITDA.
The segment measurements provided to, and evaluated by, the Chief Operating Decision Maker (“CODM”) are
described in "Note 22 - Segment Information” to our audited consolidated financial statements included elsewhere in this
Annual Report.
58
The following table presents the Company’s segment results.
Year Ended December 31, | |||||
(in thousands, except for percentages) | 2025 | 2024 | 2023 | ||
North America | |||||
Net revenues | $1,268,979 | $1,109,134 | $996,762 | ||
Adjusted EBITDA | $361,487 | $317,779 | $265,391 | ||
Adjusted EBITDA Margin | 28.5% | 28.7% | 26.6% | ||
International | |||||
Net revenues | $440,258 | $399,306 | $368,392 | ||
Adjusted EBITDA | $120,597 | $103,148 | $94,402 | ||
Adjusted EBITDA Margin | 27.4% | 25.8% | 25.6% | ||
For the Year ended December 31, 2025 v. December 31, 2024
North America
Revenue in North America increased $159.8 million, or 14%, to $1,269.0 million for the year ended December 31,
2025 compared to the year ended December 31, 2024. Equipment revenue increased $141.2 million, or 15%, year over
year, mainly driven by strong demand across all end markets, with particularly strong performance in the Vended (an
increase of 11%) and Commercial In-Home (an increase of 26%) end markets. Service parts revenue increased year over
year $14.4 million, or 13%, primarily driven by a mix of price and volume growth. Other revenues increased $3.2 million,
or 9%, primarily due to field service revenues. Equipment financing revenue increased $1.1 million, or 2%, driven by the
growth of the loan base, partially offset by lower interest income on floating loan rates decreasing alongside the prime rate.
Adjusted EBITDA increased $43.7 million, or 14%, to $361.5 million for the year ended December 31, 2025
compared to the year ended December 31, 2024 and Adjusted EBITDA Margin decreased slightly to 28.5% for the year
ended December 31, 2025 from 28.7% for the year ended December 31, 2024. This decrease was primarily driven by
product mix and investment in product development and other operational projects to drive future growth, partially offset
by the benefits of higher volumes and operational cost reduction initiatives.
International
Revenue increased $41.0 million, or 10%, to $440.3 million for the year ended December 31, 2025 compared to the
year ended December 31, 2024. Equipment revenue increased $37.6 million, or 11%, year over year, primarily due to
strong performance in Europe (an increase of 18%) and in Asia Pacific (an increase of 10%) where the expanding Vended
end markets are driving growth. Service parts revenue increased year over year $4.2 million, or 10%, primarily driven by a
mix of price and volume growth.
Adjusted EBITDA increased $17.4 million, or 17%, to $120.6 million for the year ended December 31, 2025
compared to the year ended December 31, 2024 and Adjusted EBITDA Margin increased to 27.4% for the year ended
December 31, 2025 from 25.8% for the year ended December 31, 2024. This increase was primarily driven by gross
margin expansion due to higher volumes and cost reduction initiatives in addition to operating expense controls.
Liquidity and Capital Resources
Overview
Our principal sources of liquidity are cash on hand, cash flows generated from operations, and potential borrowings
under our revolving credit facilities. We believe that our sources of liquidity will be adequate to meet our anticipated
requirements for ongoing operations, capital expenditures, working capital, interest payments, scheduled principal
payments, and other debt repayments over the next twelve months while remaining in compliance with the covenants of
our debt agreements. As of December 31, 2025 and 2024, we had unrestricted cash and cash equivalents of $123.1 million
and $154.7 million, respectively. As of December 31, 2025 and 2024, our total long-term debt, net was $1,354.6 million
and $2,034.5 million, respectively, and our total asset backed borrowings was $618.6 million and $553.8 million,
respectively.
59
We are a holding company that transacts substantially all of our business through our operating subsidiaries.
Consequently, our ability to pay dividends to stockholders, meet debt payment obligations, and pay taxes and operating
expenses is largely dependent on dividends or other distributions from our subsidiaries, whose ability to pay such
distributions to us is restricted, subject to certain exceptions, pursuant to the terms of the Credit Agreement. We currently
do not intend to declare dividends on our common stock in the foreseeable future, see “Item 5: Market for Registrant's
Common Equity, Related Stockholder Matters and Issuer Purchases of Equity Securities — Dividend Policy”.
Our principal liquidity needs have been, and we expect them to continue to be, working capital and general corporate
needs, debt service and debt reduction, capital expenditures and potential acquisitions. Our capital expenditures were $53.7
million, $43.5 million and $32.7 million for the years ended December 31, 2025, 2024 and 2023, respectively. We expect
that capital expenditures in 2026 will be approximately $60 million.
On August 19, 2024, one of the Company’s subsidiaries entered into the Credit Agreement. The Credit Agreement
provides for a Term Facility in an aggregate principal amount of $2,075.0 million, a Primary Revolving Facility with
aggregate commitments of $225.0 million, and a Thai Baht Revolving Facility with aggregate commitments of $25.0
million.
On February 20, 2025, we finalized an amendment to our Credit Agreement, which reduced the applicable margin on
the Term Loan and RCF. The result was an interest rate on our Term Loan of SOFR plus 2.75% and an interest rate on our
RCF of SOFR plus 2.50%.
On August 21, 2025, we finalized an amendment to our Credit Agreement, which reduced the applicable margin on the
Term Loan and RCF. The result is an interest rate as follows (i) the Term Facility bears interest at a rate per annum equal
to, at the applicable Borrower’s option, Term SOFR plus 2.25% or the applicable base rate plus 1.25%, (ii) the Revolving
Facilities denominated in U.S. dollars bears interest at a rate per annum equal to, at the applicable Borrower’s option, Term
SOFR plus 2.25% or the applicable base rate plus 1.25% and (iii) the Revolving Facilities denominated in Euros or Thai
baht bore interest at a rate per annum equal to Adjusted EURIBOR or the Daily Simple RFR, respectively, plus, in each
case, 2.25%. The foregoing interest rate margins will be subject to a step down of 0.25% in the event (i) the corporate
credit ratings by Moody’s Investor Services, Inc. and Standard & Poor’s Ratings Group, Inc. are B1 (stable) and B+
(stable), respectively, or higher and (ii) we achieve a First Lien Net Leverage Ratio equal to or less than 3.50 to 1.00.
In addition, the U.S. Borrower is required to pay a commitment fee equal to 0.250% per annum on any unused
commitments under the Revolving Facilities, subject to a step up to 0.375% in the event we fail to maintain a First Lien Net
Leverage Ratio equal to or less than 4.50 to 1.00. See Note 18 - Debt to the consolidated financial statements for additional
information.
The net proceeds from our initial public offering along with cash on hand were used to repay $525.0 million of our
indebtedness outstanding under the Term Loan on October 17, 2025. The repayment was first applied to and eliminated the
future required quarterly installment principal repayments. As such, the remaining balance of the Term Loan is due at
maturity on August 19, 2031, with an exception for any Excess Cash Flow payment required under the Credit Agreement.
The Company maintains a trade receivables securitization facility. ALTR LLC, a special-purpose bankruptcy remote
subsidiary of the Company, is party to a $120.0 million revolving credit facility (which represents an increase of $20.0
million from the $100.0 million facility size as of December 31, 2025, effected by an amendment entered into on May 1,
2025), which is secured by the Asset Backed Trade Receivables Facility. The Asset Backed Trade Receivables Facility is
due to expire on May 1, 2028. ALTR LLC finances the acquisition of trade receivables from Alliance Laundry Systems
through borrowings under the Asset Backed Trade Receivables Facility in the form of funding notes which are limited to
an advance rate of approximately 88% as of December 31, 2025.
The Company also maintains an internal financing organization primarily to assist end-user laundromat locations in
financing company-branded equipment through the Company’s distributors. The financing organization originates and
administers the sale of equipment financing receivables. Under this program, the Company sells certain equipment
financing receivables to a special-purpose bankruptcy remote subsidiary, which in turn transfers them to a trust. The
special-purpose subsidiary and trust are party to a revolving credit facility. On May 1, 2025, we amended our Asset Backed
Equipment Facility to increase the lender commitment to $500.0 million from $460.0 million and include a future
uncommitted lender increase of $30.0 million. On December 29, 2025, the Company entered into an agreement (the
"Facility Limit Increase Agreement") to convert the lender uncommitted amount of $30.0 million, which increased the
lender committed amount under the Asset Backed Equipment Facility from $500.0 million to $530.0 million. The Asset
Backed Equipment Facility is due to expire on May 1, 2028. The trust finances the acquisition of equipment financing
60
receivables through borrowings under the Asset Backed Equipment Facility in the form of funding notes which are limited
to an advance rate of approximately 88%.
In August 2024, following the execution of the Credit Agreement, we paid a $900.0 million dividend to common
stockholders.
We anticipate that any additional liquidity needs will be funded through, if needed, the future incurrence of additional
indebtedness, or the issuance of additional equity, or a combination thereof.
We cannot assure you that we will be able to obtain this additional liquidity on reasonable terms, or at all.
Additionally, our liquidity and our ability to meet our obligations and fund our capital requirements are also dependent on
our future financial performance, which is subject to general economic, financial, and other factors that are beyond our
control. See “Item 1A. Risk Factors.”
Cash Flows Information
The following table presents a summary of cash flows for the periods presented:
Year Ended December 31, | ||||
(in thousands) | 2025 | 2024 | ||
Net cash provided by operating activities | $211,685 | $145,460 | ||
Net cash used in investing activities | (91,647) | (87,760) | ||
Net cash used in financing activities | (157,910) | (75,374) | ||
Effect of exchange rate changes on cash and cash | (467) | (4,253) | ||
Increase/(decrease) in cash, cash equivalents, and restricted cash | $(38,339) | $(21,927) | ||
Operating Activities
Cash provided by operating activities during 2025 of $211.7 million was primarily derived from net income adjusted
for non-cash provisions and partially offset by a $50.1 million increase in working capital. The primary contributors to the
change in working capital were a $44.8 million increase in accounts and equipment financing receivables held for
securitization investors, a $13.5 million decrease in accounts payable, an increase in accounts receivable and equipment
financing receivables of $9.8 million, and an increase in inventory of $6.3 million, partially offset by an increase in other
liabilities of $20.9 million, and a $3.4 million decrease in other assets.
Cash provided by operating activities during 2024 of $145.5 million was primarily derived from net income adjusted
for non-cash provisions and partially offset by a $25.7 million increase in working capital. The primary contributors to the
change in working capital were a $26.0 million increase in accounts and equipment financing receivables held for
securitization investors and a decrease in other liabilities of $12.1 million, partially offset by a decrease in inventory of $5.8
million and a $5.6 million increase in accounts payable.
Investing Activities
Cash used by investing activities of $91.6 million for the year ended December 31, 2025 was primarily the result of
$53.7 million of capital expenditures primarily related to new and replacement manufacturing equipment and engineering
testing capabilities, $12.6 million related to the acquisitions of distributors in the United States, and $25.7 million net
outflow related to originations of securitized equipment financing receivables exceeding collections.
Cash used by investing activities of $87.8 million for the year ended December 31, 2024 was primarily the result of
$43.5 million of capital expenditures primarily related to new and replacement manufacturing equipment and engineering
testing capabilities, $27.9 million related to the acquisitions of distributors in the United States, and $18.8 million net
outflow related to originations of securitized equipment financing receivables exceeding collections.
Financing Activities
Cash used by financing activities of $157.9 million for the year ended December 31, 2025 was primarily the result of
$710.0 million in payments on long-term borrowings, partially offset by $497.0 million in net proceeds from our IPO and
$64.8 million related to a net increase in asset backed borrowings owed to securitization investors.
61
Cash used by financing activities of $75.4 million for the year ended December 31, 2024 was primarily the result of
$1,268.0 million in payments on long-term borrowings, $900.0 million for dividends to common stockholders, and $5.7
million net payments on revolving line of credit borrowings, partially offset by $2,064.6 million in proceeds from long-
term borrowings and $38.5 million related to a net increase in asset backed borrowings owed to securitization investors.
Cash Requirements
The Company's material cash requirements primarily consist of working capital requirements, repayments of long-term
debt and related interest, securitization activities, operating leases, capital expenditures, and potential acquisitions. As of
December 31, 2025, we had the following obligations:
• Long-term debt of $1.4 billion on the Term Loan, due at maturity on August 19, 2031. See “Note 18 - Debt” to our
audited consolidated financial statements included elsewhere in this Annual Report for additional information on debt
obligations and maturities. Future interest payments on the Term Loan expected to be $79.3 million over the next year.
• See “Note 10 - Leases” to our audited consolidated financial statements included elsewhere in this Annual Report for
additional information on lease obligations and maturities.
• Amounts owed to securitization investors under our Asset-backed borrowings of $618.6 million. See “Note 7 –
Securitization Activities” to our audited consolidated financial statements included elsewhere in this Annual Report for
additional information on securitization obligations and maturities.
Off–Balance Sheet Arrangements
As of December 31, 2025, we did not have any off-balance sheet arrangements, as defined in Regulation S-K
promulgated by the SEC.
Critical Accounting Policies and Use of Estimates
The preparation of financial statements in conformity with United States generally accepted accounting principles
(“GAAP”) requires us to make estimates and assumptions that affect reported amounts of assets and liabilities, disclosure
of contingent assets and liabilities at the financial statement date and reported amounts of revenues and expenses, including
amounts that are susceptible to change. Our critical accounting estimates include accounting methods and estimates
underlying such financial statement preparation, as well as judgments around uncertainties affecting the application of
those policies. In applying critical accounting estimates, materially different amounts or results could be reported under
different conditions or using different assumptions. When required, management considers the perspective of market
participants in accordance with current accounting guidance. See Note 2 - Significant Accounting Policies to our
consolidated financial statements included elsewhere in this Annual Report for a summary of our significant accounting
policies.
Goodwill and Indefinite-Lived Intangible Assets. Goodwill is tested for impairment at least annually and more
frequently if an event occurs which indicates that goodwill may be impaired. Accounting Standards Update ("ASU") No.
2017-04 Intangibles-Goodwill and Other (“Topic 350”): Simplifying the Test for Goodwill allows companies to apply a
one-step quantitative test and, as applicable, record the amount of goodwill impairment as the excess of a reporting unit’s
carrying amount over its fair value, not to exceed the total amount of goodwill allocated to the reporting unit. The estimated
fair value is determined on an income-based approach. Under the income-based approach, fair value is estimated using the
expected present value of future cash flows. There was no goodwill impairment for the years ended December 31, 2025,
2024 and 2023.
Several of the Company’s tradenames and trademarks have been deemed to have an indefinite life as the Company
expects to continue to use these assets for the foreseeable future. There are no limitations of a legal, regulatory or
contractual nature that limit the period of time for which the Company can use these assets. The Company has the right to
continue to use these assets and can continue to do so with limited cost to the Company. The effects of obsolescence,
demand, competition and other economic factors are not expected to impact the indefinite life assumptions. Intangible
assets not subject to amortization (indefinite-lived intangible assets) are tested for impairment at least annually and more
frequently if an event occurs which indicates the intangible asset may be impaired. The impairment test consists of a
comparison of the fair value of the intangible asset with its carrying amount. An impairment loss is recognized if the
carrying amount of an intangible asset exceeds its fair value in an amount equal to that excess, but not to exceed the
carrying amount of the intangible asset. The fair value of the tradenames and trademarks is determined using the relief-
62
from-royalty method. There was no impairment of our indefinite-lived assets for the years ended December 31, 2025, 2024
or 2023.
Income Taxes. The income tax provision is computed based on the pretax income included in the Company’s
consolidated statements of comprehensive income. Certain items of income and expense are not recognized on the
Company’s income tax returns and financial statements in the same year, which creates timing differences or are
permanently disallowed. The income tax effect of these timing differences results in (i) deferred income tax assets that
create a reduction in future income taxes and (ii) deferred income tax liabilities that create an increase in future income
taxes. Recognition of deferred income tax assets is based on management’s belief that it is more likely than not that the
income tax benefit associated with temporary differences will be realized. The Company records a valuation allowance to
reduce its net deferred income tax assets if, based on its assessment of future taxable income, it is more likely than not that
it will not be able to use these tax benefits. The Company may have to adjust the valuation allowance if its estimate of
future taxable income changes at any time. Recording such an adjustment could have a material adverse effect on the
Company’s consolidated statements of comprehensive income.
Product Warranty Liabilities. The costs of warranty obligations are estimated and provided for at the time of sale.
Standard product warranties vary from one to seven years. The standard warranty program includes replacement of
defective components. Additionally, the standard warranty covers labor costs for repairs solely related to Commercial In-
Home equipment. The Company also sells separately priced extended warranties associated with its commercial products.
The Company recognizes extended warranty revenues over the period covered by the warranty.
Allowance for Credit Losses – Equipment Financing Receivables. The allowance for credit losses is an estimate of
losses inherent to our equipment financing receivables portfolio. Our estimate includes accounts that have been
individually identified as impaired and estimated credit losses over a pool of receivables where it is probable that certain
receivables in the pool are impaired but that the individual accounts cannot yet be identified. When determining estimates
of probable credit loss or whether an account is impaired, management takes into consideration numerous quantitative and
qualitative factors such as historical loss experience, credit risk, portfolio duration, and economic conditions. The Company
determined that there is a limited correlation between expected credit losses and forecasted economic conditions based on a
correlation analysis performed to compare historical losses to various economic conditions, such as real gross domestic
product, inflation rate and unemployment rate. On an ongoing basis, the Company monitors credit quality based on past-
due status as there is a meaningful correlation between the past-due status of customers and the risk of credit loss.
We determine that an equipment financing receivable is impaired when it is probable that we will be unable to collect
all amounts due according to the contractual terms of the loan or lease. These equipment financing receivables are
collateral-dependent and measurement of impairment is based upon the estimated fair value of collateral. The
determination of the allowance for credit losses is based on an analysis of historical loss experience and reflects an amount
which, in our judgment, is adequate to provide for probable credit losses. When a financing receivable is non-performing,
aged greater than 89 days and the Company has exhausted all efforts of collection, the receivable is deemed to be
uncollectible and is charged off and deducted from the allowance. The allowance is increased for recoveries and by charges
to earnings.
The total allowance for credit losses as of December 31, 2025 and 2024 was $6.4 million and $5.9 million,
respectively. The reserve as a percentage of the total gross portfolio balance as of December 31, 2025 and 2024 was 1.1%
and 1.1%, respectively.
Recent Accounting Pronouncements
See Note 2 - Significant Accounting Policies to our consolidated financial statements included elsewhere in this
Annual Report for a description of recent accounting pronouncements, if any, including the expected dates of adoption and
the anticipated impact on our consolidated financial statements.
Item 7A. Quantitative and Qualitative Disclosures About Market Risk
Derivative instruments are accounted for at fair value. The accounting for changes in the fair value of a derivative
depends on the intended use, designation and type of the derivative instrument. The Company does not designate any of its
derivatives as hedges and, as such, records all changes in fair values as a component of earnings.
Using derivative instruments means assuming counterparty credit risk. Counterparty credit risk relates to the loss the
Company could incur if a counterparty were to default on a derivative contract. The Company primarily deals with
investment grade counterparties and monitors its overall credit risk and exposure to individual counterparties. The
Company does not anticipate nonperformance by any counterparties. The amount of counterparty credit exposure is the
63
unrealized gains, if any, on such derivative contracts. The Company does not require, nor does it post collateral, or security,
on such contracts.
The Company is exposed to certain risks relating to its ongoing business operations. As a result, the Company enters
into derivative transactions to manage these exposures. The primary risks managed through the use of derivative
instruments are fluctuations in interest rates, foreign currency exchange rates and commodity prices. Fluctuations in these
rates and prices can affect the Company’s operating results and financial condition. The Company manages the exposure to
these market risks through operating and financing activities and through the use of derivative financial instruments. The
Company does not enter into derivative financial instruments for trading or speculative purposes.
Interest Rate Risk
Borrowings outstanding under the Term Loan totaled $1,365.0 million at December 31, 2025. Borrowings under the
Term Loan bear interest, at the option of the applicable Borrower, at a rate equal to an applicable margin plus (a) the
applicable base rate or (b) Term SOFR (both rates as determined in accordance with the Credit Agreement). As of
December 31, 2025, the applicable margins for the Term Loan were 1.25% with respect to adjusted base rate loans and
2.25% with respect to Term SOFR loans. An assumed 10% increase/decrease in the current interest rate in effect at
December 31, 2025 would increase/decrease annual interest expense by $2.3 million on the non-hedged portion of the
borrowing.
On August 21, 2025, the Company finalized an amendment to our Credit Agreement, which reduced the applicable
margin on the Term Loan and RCF. The result is an interest rate on our Term Loan of SOFR plus a margin of 2.25% and
an interest rate on our RCF of SOFR plus a margin of 2.25%. Additionally, the amendment contains opportunities for
further margin reductions contingent upon achieving improvements in our leverage ratio and rating agency upgrades.
Effective September 3, 2024, the Company entered into a $600.0 million interest rate swap agreement to hedge a
portion of our interest rate risk related to our long-term borrowings. Under the swap, which matures on September 1, 2027,
the Company pays a fixed rate of 3.61% and receives or pays monthly interest payments based upon a comparison to the
one-month Term SOFR rate.
Effective April 1, 2025, the Company entered into a $150.0 million interest rate swap agreement to hedge a portion of
our interest rate risk related to our long-term borrowings. Under the swap, which matures on April 3, 2028, the Company
pays a fixed rate of 3.36% and receives or pays monthly interest payments based upon a comparison to the one-month
Term SOFR rate.
Foreign Currency Risk
The Company has manufacturing, sales, and distribution facilities in the Czech Republic, China and Thailand. The
Company also has various sales and distribution facilities in Brazil, France, Spain, Italy, Germany and the United Arab
Emirates. The Company also makes investments and enters into transactions denominated in foreign currencies. The vast
majority of the Company’s international sales from its domestic operations are denominated in U.S. dollars. However, the
Company is exposed to transactional and translational foreign exchange risk related to its foreign operations.
Regarding transactional foreign exchange risk, the Company from time to time enters into certain forward exchange
contracts to reduce the variability of the earnings and cash flow impacts of foreign denominated receivables and payables.
The Company does not designate these contracts as hedge transactions. Accordingly, the mark-to-market impact of these
contracts is recorded each period to current earnings. At December 31, 2025 and December 31, 2024, the Company had no
outstanding foreign currency contracts.
The Company’s primary translation exchange risk exposures at December 31, 2025 were the euro, Czech koruna, and
Thai baht. Amounts invested in non-U.S. based subsidiaries are translated into U.S. dollars at the exchange rate in effect at
period end. The resulting translation adjustments are recorded in accumulated other comprehensive (loss)/income as
foreign currency translation adjustments.
Commodity Risk
The Company is subject to the effects of changing raw material and component costs caused by movements in
underlying commodity prices. The Company purchases raw materials and components containing various commodities
including nickel, zinc, aluminum and copper. The Company generally buys these raw materials and components based
upon market prices that are established with the vendor as part of the procurement process.
64
From time to time, the Company enters into contracts with its vendors to lock in commodity prices for various periods
to limit its near-term exposure to fluctuations in raw material and component prices. In addition, the Company enters into
commodity forward contracts, for commodities such as nickel, copper and aluminum, to reduce the variability on its
earnings and cash flows of purchasing raw materials containing such commodities. The Company does not designate these
contracts as hedge transactions. Accordingly, the mark-to-market impacts of these contracts are recorded each period to
current earnings. At December 31, 2025, the Company was managing $3.1 million notional value of nickel forward
contracts and less than $0.1 million of copper forward contracts. At December 31, 2024, the Company was managing $1.7
million notional value of nickel forward contracts.
The Company presents its derivatives at gross fair values in the Company’s Consolidated Balance Sheets and does not
maintain derivative contracts which would require financial instrument or collateral balances.
65
Item 8. Financial Statements and Supplementary Data
Index to Financial Statements:
Page | ||
66
Report of Independent Registered Public Accounting Firm
To the Stockholders and the Board of Directors of Alliance Laundry Holdings Inc.
Opinion on the Financial Statements
We have audited the accompanying consolidated balance sheets of Alliance Laundry Holdings Inc. (the Company) as of
December 31, 2025 and 2024, the related consolidated statements of comprehensive income, stockholders' equity/(deficit)
and cash flows for each of the three years in the period ended December 31, 2025, and the related notes and financial
statement schedule listed in the Index at Item 15(b) (collectively referred to as the “consolidated financial statements”). In
our opinion, the consolidated financial statements present fairly, in all material respects, the financial position of the
Company at December 31, 2025 and 2024, and the results of its operations and its cash flows for each of the three years in
the period ended December 31, 2025, in conformity with U.S. generally accepted accounting principles.
Basis for Opinion
These financial statements are the responsibility of the Company's management. Our responsibility is to express an opinion
on the Company’s financial statements based on our audits. We are a public accounting firm registered with the Public
Company Accounting Oversight Board (United States) (PCAOB) and are required to be independent with respect to the
Company in accordance with the U.S. federal securities laws and the applicable rules and regulations of the Securities and
Exchange Commission and the PCAOB.
We conducted our audits in accordance with the standards of the PCAOB. Those standards require that we plan and
perform the audit to obtain reasonable assurance about whether the financial statements are free of material misstatement,
whether due to error or fraud. The Company is not required to have, nor were we engaged to perform, an audit of its
internal control over financial reporting. As part of our audits, we are required to obtain an understanding of internal
control over financial reporting but not for the purpose of expressing an opinion on the effectiveness of the Company’s
internal control over financial reporting. Accordingly, we express no such opinion.
Our audits included performing procedures to assess the risks of material misstatement of the financial statements, whether
due to error or fraud, and performing procedures that respond to those risks. Such procedures included examining, on a test
basis, evidence regarding the amounts and disclosures in the financial statements. Our audits also included evaluating the
accounting principles used and significant estimates made by management, as well as evaluating the overall presentation of
the financial statements. We believe that our audits provide a reasonable basis for our opinion.
Critical Audit Matter
The critical audit matter communicated below is a matter arising from the current period audit of the financial statements
that was communicated or required to be communicated to the audit committee and that: (1) relates to accounts or
disclosures that are material to the financial statements and (2) involved our especially challenging, subjective or complex
judgments. The communication of the critical audit matter does not alter in any way our opinion on the consolidated
financial statements, taken as a whole, and we are not, by communicating the critical audit matter below, providing a
separate opinion on the critical audit matter or on the accounts or disclosures to which it relates.
67
Product Warranty Liability | ||
Description of the Matter | At December 31, 2025, the Company’s product warranty liability was $69.2 million. As more fully described in Notes 2 and 16 to the consolidated financial statements, the Company estimates and records provisions for future product warranty liability claims at the time of sale based on projected incident rates of occurrence and projected cost per incident. The Company estimates its product warranty liability based on the specific product type, product use, and warranty period, which generally ranges from one to seven years. Auditing the Company’s product warranty liability was complex due to the judgmental nature of management’s assumptions used to estimate the future commercial in-home product warranty liability for standard product warranty periods extending beyond three years, including the projected incident rates of occurrence and the projected cost per incident. In particular, there is a higher level of estimation uncertainty in determining the future projected incident rates of occurrence, which may not be reflective of historical incident rates or may not reflect product quality issues that have not yet been identified as of the financial statement date. Additionally, the projected cost per incident reflects management’s estimates of the future cost of replacement product parts, the cost of labor, and the amount of labor required to address the product warranty claim and changes in these estimates could have a material effect on the amount of product warranty liability recognized. | |
How We Addressed the Matter in Our Audit | To test the adequacy of the Company’s calculation of the product warranty liability, our substantive audit procedures included, among others, testing the accuracy and completeness of the underlying data used in the product warranty liability calculation and significant assumptions discussed above. We tested the categorization of claims within the product warranty liability calculation and tested the completeness and accuracy of the claims settled data. We compared the historical incident rates of occurrence by product type, using actual claims data, to the projected incident rates of occurrence. We also compared the projected cost per incident to the average cost per incident using actual claims data. We assessed the historical accuracy of management's estimates by comparing the product warranty liability in the prior year to the actual claims paid in the subsequent year. | |
/s/ Ernst & Young LLP
We have served as the Company’s auditor since 2017.
March 13, 2026
68
Alliance Laundry Holdings Inc.
CONSOLIDATED BALANCE SHEETS
(in thousands, except share and per share amounts)
December 31, 2025 | December 31, 2024 | ||
Assets | |||
Current assets: | |||
Cash and cash equivalents | $ | $ | |
Restricted cash | |||
Restricted cash - for securitization investors | |||
Accounts receivable (net of allowance for credit losses of $ | |||
Inventories, net | |||
Inventories, net - related parties | |||
Accounts receivable, net - restricted for securitization investors | |||
Equipment financing receivables, net | |||
Equipment financing receivables, net - restricted for securitization investors | |||
Prepaid expenses and other current assets | |||
Total current assets | |||
Equipment financing receivables, net | |||
Property, plant, and equipment, net | |||
Operating lease right-of-use assets | |||
Equipment financing receivables, net - restricted for securitization investors | |||
Deferred income tax asset | |||
Debt issuance costs, net | |||
Goodwill | |||
Intangible assets, net | |||
Other long-term assets | |||
Total assets | $ | $ | |
Liabilities and Stockholders' Equity/(Deficit) | |||
Current liabilities: | |||
Current portion of long-term debt | $ | $ | |
Accounts payable | |||
Accounts payable - related parties | |||
Asset backed borrowings - owed to securitization investors | |||
Current operating lease liabilities | |||
Other current liabilities | |||
Total current liabilities | |||
Long-term debt, net | |||
Asset backed borrowings - owed to securitization investors | |||
Deferred income tax liability | |||
Long-term operating lease liabilities | |||
Other long-term liabilities | |||
Total liabilities | |||
Commitments and contingencies (see Note 24) | |||
Stockholders' equity/(deficit): | |||
Redeemable preferred stock, $ | |||
Common stock, $ | |||
Additional paid-in capital | |||
(Accumulated deficit)/retained earnings | ( | ||
Accumulated other comprehensive income/(loss) | ( | ||
Treasury stock, at cost, | ( | ||
Total stockholders' equity/(deficit) | ( | ||
Total liabilities and stockholders' equity/(deficit) | $ | $ |
The accompanying notes are an integral part of these consolidated financial statements.
69
Alliance Laundry Holdings Inc.
CONSOLIDATED STATEMENTS OF COMPREHENSIVE INCOME
(in thousands, except per share amounts)
December 31, 2025 | December 31, 2024 | December 31, 2023 | |||
Net revenues: | |||||
Equipment, service parts and other | $ | $ | $ | ||
Equipment financing | |||||
Net revenues | |||||
Costs and expenses: | |||||
Cost of sales | |||||
Cost of sales - related parties | |||||
Equipment financing expenses | |||||
Gross profit | |||||
Selling, general, and administrative expenses | |||||
Selling, general, and administrative expenses - related parties | |||||
Other costs | |||||
Total operating expenses | |||||
Operating income | |||||
Interest expense, net | |||||
Other expenses, net | |||||
Other expenses, net - related parties | |||||
Income before taxes | |||||
Provision for income taxes | |||||
Net income | $ | $ | $ | ||
Comprehensive income: | |||||
Net income | $ | $ | $ | ||
Other comprehensive income/(loss): | |||||
Foreign currency translation adjustment | ( | ||||
Change in pension liability and other post-retirement benefits, net of taxes of $ ($ | ( | ||||
Total other comprehensive income/(loss) | ( | ||||
Comprehensive income | $ | $ | $ | ||
Net income per share attributable to common stockholders: | |||||
Basic | $ | $ | $ | ||
Diluted | $ | $ | $ | ||
Weighted average number of common shares outstanding | |||||
Basic | |||||
Diluted | |||||
Dividends declared per share of common stock | $ | $ | $ |
The accompanying notes are an integral part of these consolidated financial statements.
70
Alliance Laundry Holdings Inc.
CONSOLIDATED STATEMENTS OF STOCKHOLDERS' EQUITY/(DEFICIT)
(in thousands)
Common Stock | Paid-in Capital | Treasury Stock | (Accumulate d Deficit)/ Retained Earnings | Accumulated Other Comprehensive Income/(loss) | Total Stockholders' Equity/(Deficit) | ||||||
Balances at December 31, 2022 | $ | $ | $( | $ | $ | $ | |||||
Net income | — | — | — | — | |||||||
Foreign currency translation adjustment | — | — | — | — | |||||||
Change in pension liability and other post-retirement benefits, net | — | — | — | — | |||||||
Exercise of stock options and taxes paid for net share settlement | ( | — | — | — | ( | ||||||
Exercise of stock options | — | — | — | — | |||||||
Repurchase of common stock | — | — | ( | — | — | ( | |||||
Share-based compensation | — | — | — | — | |||||||
Balances at December 31, 2023 | ( | ||||||||||
Net income | — | — | — | — | |||||||
Foreign currency translation adjustment | — | — | — | — | ( | ( | |||||
Change in pension liability and other post-retirement benefits, net | — | — | — | — | |||||||
Exercise of stock options and taxes paid for net share settlement | ( | — | — | — | ( | ||||||
Exercise of stock options | — | — | — | — | |||||||
Repurchase of common stock | — | — | ( | — | — | ( | |||||
Dividends | — | — | — | ( | — | ( | |||||
Return of capital | — | ( | — | — | — | ( | |||||
Share-based compensation | — | — | — | — | |||||||
Balances at December 31, 2024 | ( | ( | ( | ||||||||
Net income | — | — | — | — | |||||||
Foreign currency translation adjustment | — | — | — | — | |||||||
Change in other post-retirement benefits, net | — | — | — | — | ( | ( | |||||
Exercise of stock options and taxes paid for net share settlement | ( | — | ( | — | ( | ||||||
Exercise of stock options | — | — | — | ||||||||
Exercise of warrants | ( | — | — | — | |||||||
Issuance of common stock | — | — | — | — | |||||||
Common stock issued pursuant to initial public offering, net of offering costs | — | — | — | ||||||||
Repurchase of common stock | — | — | ( | — | — | ( | |||||
Share-based compensation | — | — | — | — | |||||||
Retirement of treasury stock | ( | ( | ( | — | |||||||
Balances at December 31, 2025 | $ | $ | $ | $( | $ | $ |
The accompanying notes are an integral part of these consolidated financial statements.
71
Alliance Laundry Holdings Inc.
CONSOLIDATED STATEMENTS OF CASH FLOWS
(in thousands)
December 31, 2025 | December 31, 2024 | December 31, 2023 | |||
Cash flows from operating activities: | |||||
Net income | $ | $ | $ | ||
Adjustments to reconcile net income to net cash provided by operating activities: | |||||
Depreciation and amortization | |||||
Amortization and extinguishment of debt issuance costs | |||||
Amortization of original issue discount | |||||
Non-cash interest expense/(income) | ( | ||||
Non-cash (gain)/loss on commodity & foreign exchange contracts, net | ( | ||||
Non-cash foreign exchange loss/(gain), net | ( | ||||
Non-cash stock-based compensation | |||||
Non-cash (gain)/loss for pension and post-retirement benefit plans | ( | ||||
Loss on sale of property, plant, and equipment | |||||
Provision for credit losses | |||||
Deferred income taxes | ( | ( | ( | ||
Other, net | ( | ||||
Changes in assets and liabilities, net of the effects of acquisitions: | |||||
Accounts and equipment financing receivables, net | ( | ||||
Accounts receivable - restricted for securitization investors | ( | ||||
Inventories, net | ( | ||||
Inventories, net - related party | ( | ||||
Equipment financing receivables, net - restricted for securitization investors | ( | ( | ( | ||
Other assets | |||||
Accounts payable | ( | ( | |||
Accounts payable - related parties | ( | ||||
Other liabilities | ( | ||||
Net cash provided by operating activities | |||||
Cash flows from investing activities: | |||||
Capital expenditures | ( | ( | ( | ||
Acquisition of businesses, net of cash acquired | ( | ( | ( | ||
Proceeds on disposition of assets | |||||
Originations of equipment financing receivables, net - restricted for securitization investors | ( | ( | ( | ||
Collections of equipment financing receivables, net - restricted for securitization investors | |||||
Net cash used in investing activities | ( | ( | ( | ||
Cash flows from financing activities: | |||||
Payments on revolving line of credit borrowings | ( | ( | |||
Proceeds from long-term borrowings | |||||
Payments on long-term borrowings | ( | ( | ( | ||
Cash paid for debt establishment and amendment fees | ( | ( | |||
Proceeds from initial public offering, net of issuance costs | |||||
Increase in asset backed borrowings owed to securitization investors | |||||
Decrease in asset backed borrowings owed to securitization investors | ( | ( | ( | ||
Dividends paid | ( | ||||
Return of capital paid | ( | ||||
Repurchase of common stock | ( | ( | ( | ||
Taxes paid related to net share settlement of stock options | ( | ( | ( | ||
Net proceeds from stock options exercised | |||||
Proceeds from common stock issuance under employee purchase plan | |||||
Net cash used in financing activities | ( | ( | ( | ||
Effect of exchange rate changes on cash, cash equivalents, and restricted cash | ( | ( | ( | ||
(Decrease)/increase in cash, cash equivalents, and restricted cash | ( | ( | |||
Cash, cash equivalents, and restricted cash at beginning of period | |||||
Cash, cash equivalents, and restricted cash at end of period | $ | $ | $ | ||
72
Reconciliation of cash, cash equivalents, and restricted cash to the Consolidated Balance Sheets: | |||||
Cash and cash equivalents | $ | $ | $ | ||
Restricted cash | |||||
Restricted cash - for securitization investors | |||||
Total cash, cash equivalents, and restricted cash shown in the Statement of Cash Flows | $ | $ | $ | ||
Supplemental disclosure of cash flow information: | |||||
Cash paid for interest | $ | $ | $ | ||
Cash paid for interest - to securitized investors | $ | $ | $ | ||
Cash paid for income taxes | $ | $ | $ | ||
Supplemental disclosure of investing and financing non-cash activities: | |||||
Capital expenditures included in accounts payable | $ | $ | $ |
The accompanying notes are an integral part of these consolidated financial statements.
73
Alliance Laundry Holdings Inc.
NOTES TO CONSOLIDATED FINANCIAL STATEMENTS
Note 1 - Description of Business and Basis of Presentation
Description of Business
Alliance Laundry Holdings Inc. (“ALH” or the “Company”) through its subsidiaries designs and manufactures a full
line of commercial and residential laundry equipment for sale in the U.S. and international markets. The Company
manufactures products in the United States in Ripon, Wisconsin and Manitowoc, Wisconsin, in Europe in Pribor, Czech
Republic, and in Asia Pacific in Chonburi, Thailand and Guangzhou, China. Additionally, the Company provides
equipment financing to laundromat operators and other end-users primarily in the U.S.
Stockholders' Equity/(Deficit) and Capital Structure Changes
On September 25, 2025, the Company’s board of directors and stockholders approved a 142 -for-1 stock split of the
company’s issued and outstanding shares of common stock, including the shares of common stock underlying outstanding
stock options. This stock split was effected on September 26, 2025. All issued and outstanding share and per share amounts
of common stock and stock options included in the accompanying consolidated financial statements have been
retroactively adjusted to reflect this stock split for all periods presented. The par value of the common stock was not
adjusted as a result of the split and retained a par value of $0.01 per share. Accordingly, an amount equal to the par value of
the additional shares issued resulting from the stock split was reclassified from additional paid-in capital to common stock.
Additionally, on September 25, 2025 the board of directors retired and cancelled all treasury shares.
On September 25, 2025, Alliance Laundry Holdings Inc. filed a Certificate of Amendment to its Certificate of
Incorporation to amend the authorized shares to 2,000,000,000 shares of common stock and 100,000,000 shares of
preferred stock.
Initial Public Offering
The Company’s registration statement on Form S-1 related to its initial public offering (“IPO”) was declared effective
on September 30, 2025 and the Company’s common stock began trading on the New York Stock Exchange on October 9,
2025. The Company's final prospectus (the “IPO Prospectus”) was filed with the SEC on October 9, 2025. On October 10,
2025 (the “IPO Closing Date”), the Company closed its IPO pursuant to which 43,195,120 shares of its common stock
were sold, which includes the issuance and sale of 24,390,243 shares by the Company and the sale by a selling stockholder
of 18,804,877 shares, which includes the full exercise of the underwriters’ option to purchase 5,634,146 additional shares,
at a price to the public of $22.00 per share. The Company received net proceeds of approximately $505.7 million, after
deducting the underwriting discounts and commissions and other offering expenses of approximately $30.8 million.
Additionally, other offering costs of $8.7 million, consisting of direct incremental legal, accounting, consulting and other
fees related to the IPO, were recorded as an offset to IPO proceeds in the Consolidated Statements of Stockholder's Equity/
(Deficit).
The Consolidated Financial Statements include the accounts of ALH and all its majority-owned or controlled
subsidiaries that are consolidated in conformity with accounting principles generally accepted in the United States of
America (“U.S. GAAP”). The Company consolidates its Asset Backed Facilities trust in accordance with variable interest
entity accounting guidance as discussed in more detail in Note 6 - Asset Backed Facilities. All significant intercompany
transactions have been eliminated. Gains and losses from the translation of substantially all foreign currency financial
statements are recorded in the Accumulated other comprehensive income/(loss) within Stockholders' equity/(deficit).
Note 2 - Significant Accounting Policies
The preparation of financial statements in conformity with generally accepted accounting principles requires the
Company to make estimates and assumptions that affect the reported amounts of assets and liabilities and disclosure of
74
contingent assets and liabilities at the date of the financial statements and the reported amounts of revenues and expenses
during the reporting period. Actual results could differ from those estimates.
All highly liquid instruments with an initial maturity of three months or less at the date of purchase are considered cash
equivalents. Restricted cash primarily represents cash in escrow accounts related to acquisitions and cash collection and
reserve accounts restricted for securitization investors.
Basic net income per share of common stock is computed by dividing net income attributable to common stockholders
by the weighted average number of common shares outstanding during the respective reporting period.
Diluted net income per share of common stock is calculated by including the basic weighted-average shares of
common stock outstanding adjusted for the effects of all potential dilutive shares of common stock that are calculated using
the treasury stock method for stock options and warrants outstanding and unvested restricted stock. The treasury stock
method assumes that the Company uses the proceeds from the exercise of stock option awards to repurchase common stock
at the average market price during the period. The assumed proceeds under the treasury stock method include the purchase
price that the option holder will pay in the future and compensation cost for future service that the Company has not yet
recognized. For unvested restricted stock, assumed proceeds include unamortized compensation cost. Potential shares with
anti-dilutive effects are excluded from the diluted net income per share of common stock calculation.
Revenue from product sales is recognized when all of the following criteria are met: (i) the Company and an
independent customer approve a contract with commercial substance, (ii) the performance obligations in the contract are
identified, (iii) the sales price is determinable and collectible, (iv) the sales price of a contract is allocated to each distinct
performance obligation and (v) the performance obligations have been satisfied through the transfer of control of the goods
to the customer. Generally, control is transferred when the risk and rewards of ownership are transferred to the customer.
Except for certain sales to international customers, which are recognized upon receipt by the customer, these criteria are
primarily satisfied and revenue is recognized upon shipment. See Note 3 – Net Revenues for more information.
Revenues are recorded net of sales incentive allowances, which are recognized as a deduction from sales at the time of
sale. Sales incentive allowances include customer promotional programs and volume rebates that require the Company to
estimate and accrue the ultimate costs of such programs. The Company maintains an accrual at the end of each period for
the earned, but unpaid costs related to such programs.
The Company offers certain customers the right to return eligible equipment and other purchases. Returns are not
significant for any period presented.
Deposits received from customers prior to satisfying revenue recognition performance obligations are recorded in
Other current liabilities. Customer deposits are recognized into revenue when control of the goods passes to the customer,
million as of December 31, 2025 and 2024, respectively.
The Company participates in a supplier financing arrangement with a third-party financial institution that allows
suppliers to request early payment for eligible receivables at their sole discretion. These arrangements do not alter the
Company’s obligations to its suppliers, including amounts due and scheduled payment terms. Obligations under the
supplier financing program are classified as Accounts payable in the Consolidated Balance Sheets. The Company discloses
the key terms of the program, the outstanding amount under the program at the end of each reporting period and provides
the Company’s supplier financing arrangements.
75
Equipment financing receivables, net reflect equipment loans that the Company expects to sell in the short-term to the
Company’s existing securitization facility as well as other loans not eligible for sale to the facility. Equipment financing
receivables, net and Equipment financing receivables, net - restricted for securitization investors are stated at the principal
amount outstanding net of the allowance for credit losses. Interest income is accrued as earned on outstanding balances.
Recognition of income is suspended, and previously recorded accrued interest income is reversed, when it is determined
that collection of future income is not probable (after 89 days past due). Fees earned and incremental direct costs incurred
upon origination of equipment financing are not significant for any period presented.
In accordance with Accounting Standards Codification (“ASC”) 230, Statement of Cash Flows, the Company records
cash flows associated with equipment loans provided directly to the Company’s customers as operating cash flows. The
Company considers these lending activities to be an integral component of its primary revenue-generating operations, as
they directly support sales to customers and are part of the Company’s ordinary course of business. The Company records
cash flows associated with equipment loans with borrowers who purchase their equipment through the Company’s
independent distribution network as cash flows from investing activities. The Company considers these loans to be
investments that support sales through external channels rather than direct revenue-generating activities.
The Company sells a majority of its trade and equipment financing receivables originated in the U.S. to special-
purpose bankruptcy remote entities and a related trust. In a subordinated capacity, the Company retains rights to the
residual portion of cash flows, including interest earned, from the equipment financing receivables sold. The Company
consolidates the trust, including the assets and liabilities associated with the sale of accounts and equipment financing
receivables, into its Consolidated Financial Statements.
Financing Program Revenue
The Company sells trade and equipment financing receivables through its special-purpose bankruptcy remote entities
and a related trust. As servicing agent, the Company retains collection and administrative responsibilities for the accounts
and equipment financing receivables. The Company recognizes interest income on sold equipment financing receivables in
the period the interest is earned. The Company receives a servicing fee, based on the average outstanding balance, for the
equipment financing receivables sold. The Company does not establish a servicing asset or liability because the servicing
fee adequately compensates the Company for the retained servicing rights.
The allowance for credit losses is an estimate of losses inherent to the Company’s equipment financing receivables
portfolio. The Company’s estimate includes accounts that have been individually identified as impaired and estimated
credit losses over a pool of receivables where it is probable that certain receivables in the pool are impaired but that the
individual accounts cannot yet be identified. When determining estimates of probable credit loss or whether an account is
impaired, management takes into consideration numerous quantitative and qualitative factors such as historical loss
experience, credit risk, portfolio duration and economic conditions. The Company determined that there is a limited
correlation between expected credit losses and forecasted economic conditions based on a correlation analysis performed to
compare historical losses to various economic conditions, such as real gross domestic product, inflation rate and
unemployment rate. On an ongoing basis, the Company monitors credit quality based on past-due status as there is a
meaningful correlation between the past-due status of customers and the risk of credit loss.
The Company determines that an equipment financing receivable is impaired when it is expected that it will be unable
to collect all amounts due according to the contractual terms of the loan or lease. These equipment financing receivables
are collateral–dependent and measurement of impairment is based upon the estimated fair value of collateral. The
determination of the allowance for credit losses is based on an analysis of historical loss experience and reflects an amount
which, in the Company’s judgment, is adequate to provide for probable credit losses. When a financing receivable is non-
performing, aged greater than 89 days and the Company has exhausted all efforts of collection, the receivable is deemed to
be uncollectible and is charged off and deducted from the allowance. The allowance is increased for recoveries and by
charges to earnings.
76
The total allowance for credit losses as of December 31, 2025 and 2024 was $6.4 million and $5.9 million,
respectively. The reserve as a percentage of the total gross portfolio balance was 1.1 % and 1.1 % as of December 31, 2025
and 2024, respectively.
Inventories are valued at cost, which approximate costs determined on the first-in, first-out method but not in excess of
net realizable value. The Company’s policy is to evaluate all inventories for obsolescence on a quarterly basis. Inventory in
excess of the Company’s estimated usage requirements is recorded at its estimated net realizable value. Inherent in the
estimates of net realizable value are estimates related to future manufacturing schedules, customer demand, possible
alternate uses and ultimate realization of potentially excess inventory.
Accounts receivable consists primarily of trade receivables and is carried at sales value less allowance for credit losses,
representing the Company’s estimate of the net amount expected to be realized in cash. The Company reviews the
allowance for credit losses on an ongoing basis, using historical payment trends, write-off experience, credit conditions,
economic conditions, and other specific customer circumstances, and adjustments are made to the allowance as necessary.
Long lived assets (property, plant and equipment and other intangible assets with definite lives) are stated at cost, less
accumulated depreciation and amortization. Betterments and major renewals are capitalized and included in property, plant
and equipment while expenditures for maintenance and minor renewals are charged to expense. Other intangible assets
with definite lives consist primarily of customer agreements and distributor networks, engineering drawings, product
designs and manufacturing processes, trademarks, patents and computer software.
The costs of assets and related accumulated depreciation and amortization are eliminated when assets are retired or
otherwise disposed of and any resulting gain or loss is reflected in operating costs. Long-lived assets to be held and used
are reviewed for impairment whenever events or changes in circumstances indicate that the related carrying amount may
not be recoverable based upon related estimated future undiscounted cash flows. Impairment losses on assets to be held and
used are recognized, when required, when the fair value of the asset is less than its carrying value. Long-lived assets to be
disposed of by sale are reported at the lower of carrying amount or fair value less cost to sell.
Depreciation and amortization are computed over the estimated useful lives of the respective assets using the straight-
line method for financial reporting purposes and accelerated methods for income tax purposes. Depreciation provisions for
property, plant and equipment are based on the following estimated useful lives: buildings 40 years; machinery and
equipment (including production tooling) 5 to 10 years; vehicles 4 years; and data processing equipment 3 years. Leasehold
improvements are amortized over the lesser of the remaining life of the lease or the estimated useful life of the
improvement. Other intangible assets with definite lives are amortized over the assets’ estimated useful lives which range
Goodwill and Indefinite-Lived Intangible Assets
indicates that goodwill may be impaired. Accounting Standards Update ("ASU") No. 2017-04 Intangibles-Goodwill and
Other (“Topic 350”): Simplifying the Test for Goodwill allows companies to apply a one-step quantitative test and, as
applicable, record the amount of goodwill impairment as the excess of a reporting unit’s carrying amount over its fair
value, not to exceed the total amount of goodwill allocated to the reporting unit. The estimated fair value is determined
using a combination of the income approach and the market approach which involves the use of estimates. Under the
income-based approach, fair value is estimated using the expected present value of future cash flows as determined with
the assistance of a third party. Estimating future cash flows to be generated by the reporting unit requires significant
judgments and assumptions by Management including sales, operating margins, royalty rates, discount rates, and future
economic conditions. The Company believes its assumptions to be consistent with those a market participant would use for
valuation purposes.
expects to continue to use these assets for the foreseeable future. There are no limitations of a legal, regulatory or
77
contractual nature that limit the period of time for which the Company can use these assets. The Company has the right to
continue to use these assets and can continue to do so with limited cost to the Company. The effects of obsolescence,
demand, competition and other economic factors are not expected to impact the indefinite life assumptions. Intangible
assets not subject to amortization (indefinite-lived intangible assets) are tested for impairment at least annually, on October
1, and more frequently if an event occurs which indicates the intangible asset may be impaired. The impairment test
consists of a comparison of the fair value of the intangible asset with its carrying amount. An impairment loss is recognized
if the carrying amount of an intangible asset exceeds its fair value in an amount equal to that excess, but not to exceed the
carrying amount of the intangible asset. The fair value of the tradenames and trademarks is determined with the assistance
of a third party using the relief-from-royalty method.
A considerable amount of management judgment and assumptions are required in performing the impairment tests,
principally in estimating future cash flows of each reporting unit and determining the fair value of the indefinite-lived
intangible assets.
There was no
2024 and 2023.
The income tax provision is computed based on the pretax income included in the Consolidated Statements of
Comprehensive Income. Certain items of income and expense are not recognized on the Company’s income tax returns and
financial statements in the same year, which creates timing differences or are permanently disallowed. The income tax
effect of these timing differences results in (1) deferred income tax assets that create a reduction in future income taxes and
(2) deferred income tax liabilities that create an increase in future income taxes. Recognition of deferred income tax assets
is based on management’s belief that it is more likely than not that the income tax benefit associated with temporary
differences will be realized. The Company records a valuation allowance to reduce its net deferred income tax assets if,
based on its assessment of future taxable income, it is more likely than not that it will not be able to use these tax benefits.
The Company may have to adjust the valuation allowance if its estimate of future taxable income changes at any time.
Recording such an adjustment could have a material adverse effect on the Company’s Consolidated Statements of
Comprehensive Income. The Company releases income tax effects from Accumulated other comprehensive (loss)/income
when individual assets or liabilities are sold, terminated or extinguished.
The Tax Cuts and Jobs Act was signed into federal law on December 22, 2017. The Act subjects a US shareholder to
current tax on global intangible low-taxed income (GILTI) earned by certain foreign subsidiaries. The FASB Staff Q&A,
Topic 740 No. 5, Accounting for Global Intangible Low-Taxed Income, states that an entity can make an accounting policy
election to either recognize deferred taxes for temporary differences expected to reverse as GILTI in future years or provide
for the tax expense related to GILTI in the year the tax is incurred. We have elected to recognize the tax on GILTI as a
The costs of warranty obligations are estimated and provided for at the time of sale. Standard product warranties vary
from one to seven years . The standard warranty program includes replacement of defective components. Additionally, the
standard warranty covers labor costs for repairs solely related to Commercial In-Home equipment. The Company also sells
separately priced extended warranties associated with its commercial products. The Company recognizes extended
in the table in Note 16 - Product Warranties.
Advertising costs are expensed as incurred and are included in Selling, general and administrative expenses in the
$12.2 million for the year ended December 31, 2025, 2024 and 2023, respectively.
Shipping and handling fees charged to customers are reflected in Net revenues and shipping and handling expenses are
reflected in Cost of sales.
78
The Company enters into new, or amends existing, credit agreements to support its operations, fund acquisitions,
securitization activities, dividend distributions and other purposes. These refinancing activities and related costs, as well as
any capitalized costs and original issue discounts from prior transactions, are capitalized or expensed in accordance with
the debt modification and debt extinguishment accounting guidance. Debt issuance costs are amortized using the effective
interest rate method or straight line when straight line approximates the effective interest rate method.
In August 2024, the Company incurred $32.8 million of fees in connection with the execution of the Credit
Agreement. Of these fees, $30.4 million was expensed and included in Other expenses, net and Other expenses, net -
related parties in the Consolidated Statements of Comprehensive Income. The remaining $2.4 million related to the
revolving credit facility and was included in Other long-term assets in the Consolidated Balance Sheets. The Company also
recorded $10.4 million for original issuance discount in 2024 related to the Credit Agreement, which is included in Long-
term debt, net in the Consolidated Balance Sheets. Additionally, the Company wrote off a portion of the unamortized debt
issuance costs and original issuance discounts related to the Prior Credit Agreement, resulting in expense of $2.8 million
recorded in Other expenses, net in the Consolidated Statements of Comprehensive Income.
On February 20, 2025 we finalized an amendment to our Credit Agreement, which reduced the applicable margin on
the Term Loan and RCF. The Company incurred $1.0 million of fees in connection with this amendment which were
expensed and included in Other expenses, net in the Consolidated Statements of Comprehensive Income.
On August 21, 2025, we finalized an amendment to our Credit Agreement, which reduced the applicable margin on the
Term Loan and RCF. The Company incurred $1.3 million of fees in connection with this amendment which were expensed
and included in Other expenses, net in the Consolidated Statements of Comprehensive Income.
The Company wrote off a portion of the unamortized debt issuance costs and original issuance discounts related to the
Prior Credit Agreement, resulting in expense of $1.3 million recorded in Other expenses, net in the Consolidated
Statements of Comprehensive Income for the year ended December 31, 2025.
See Note 18 - Debt for further information on the Credit Agreement.
The functional currency of the Company's foreign subsidiaries is the local currency in which the subsidiary operates.
The Company translates the results of operations of its foreign entities using average exchange rates for each month while
balance sheet accounts are translated using exchange rates at the end of each period. The Company records the foreign
transaction losses/(gains) recorded in earnings were $1.2 million, $0.7 million, and $(0.3 ) million for the year ended
December 31, 2025, 2024, and 2023 respectively. Additionally, foreign exchange losses/(gains) on intercompany loans of
$25.2 million, $(4.7 ) million, and $0.5 million were recorded in earnings for the years ended December 31, 2025, 2024,
and 2023, respectively, see Note 5 - Other Expenses, net for further information.
Research and development expenditures are expensed as incurred and are included in the Selling, general and
$29.7 million, $22.8 million and $22.8 million for the year ended December 31, 2025, 2024 and 2023, respectively.
The carrying amounts reported in the Consolidated Balance Sheets for Cash and cash equivalents, Restricted cash,
Restricted cash - for securitization investors, Accounts receivable, net, Accounts receivable, net - restricted for
securitization investors, Equipment financing receivables, net - restricted for securitization investors, Accounts payable and
Asset backed borrowings - owed to securitization investors approximate fair value either due to the short-term nature or
longer-term instruments which have interest at variable rates that re-price frequently. The fair value of interest rate swaps
and commodity and foreign exchange hedges are obtained based upon third party quotes.
79
Current accounting guidance defines fair value as the exchange price that would be received for an asset or paid to
transfer a liability (an exit price) in the principal or most advantageous market for the asset or liability in an orderly
transaction between market participants. It also specifies a fair value hierarchy based upon the observability of inputs used
in valuation techniques. Observable inputs (highest level) reflect market data obtained from independent sources while
unobservable inputs (lowest level) reflect internally developed market assumptions. In accordance with the guidance, fair
value measurements are classified under the following hierarchy:
•Level 1 - Quoted prices for identical instruments in active markets.
•Level 2 - Quoted prices for similar instruments in active markets, quoted prices for identical or similar instruments
in markets that are not active and model-derived valuations in which all significant inputs or significant value-
drivers are observable in active markets.
•Level 3 - Model-derived valuations in which one or more significant inputs or significant value-drivers are
unobservable.
When available, the Company uses quoted market prices to determine fair value and classifies such measurements
within Level 1. In some cases where market prices are not available, the Company makes use of observable market-based
inputs to calculate fair value, in which case the measurements are classified within Level 2. If quoted or observable market
prices are not available, fair value is based upon internally developed models that use, where possible, current market-
based parameters such as interest rates, yield curves and currency rates. These measurements are classified within Level 3.
Fair value measurements are classified according to the lowest level input or value-driver that is significant to the
valuation. A measurement may therefore be classified within Level 3 even though there may be significant inputs that are
readily observable.
Changes in the fair value of derivatives are recognized in Net income or Accumulated other comprehensive income/
(loss), as appropriate. The Company does not designate any of its derivatives as hedges and, as such, records all changes in
Financial instruments that potentially subject the Company to concentrations of credit risk include trade accounts
receivable and equipment financing receivables. Concentrations of credit risk with respect to trade receivables and
equipment financing receivables are limited, to a degree, by the large number of geographically diverse customers that
make up the Company’s customer base. The Company controls credit risk through credit approvals, credit limits,
monitoring procedures, and secured payment terms.
The Company issues stock-based compensation awards to employees in the form of service-based and performance-
based stock options (collectively, “option awards”) and restricted stock units ("RSUs"). The awards are accounted for in
accordance with ASC 718, Compensation: Stock Compensation (“ASC 718”), by measuring the fair value as of the grant
date. Options awards have a term of 10 years and an exercise price equal to 100 % of the fair market value of the
Company’s common stock at the grant date. Granted service options vest in five equal annual installments of the stated
vesting commencement date with the potential for accelerated vesting upon a change in control of ALH. The RSUs granted
to employees generally vest ratably over four years . The Company has elected to recognize the resulting compensation
costs for service-based awards and RSUs on a straight-line basis over the requisite service period of the award.
Performance-based awards issued prior to our IPO were structured to vest upon the occurrence of a liquidity event,
defined as: (i) a Change in Control; (ii) a Public Offering; (iii) a SPAC Transaction; or (iv) a Direct Listing, provided that
our principal stockholder received aggregate proceeds in excess of a deemed investment threshold and achieved a specified
internal rate of return. The grant date fair value of these performance-based awards was estimated using a Monte Carlo
simulation model. In October 2025, in connection with the consummation of the Company's IPO, the awards fully vested,
and the Company recognized expense of $16.0 million in the fiscal quarter ended December 31, 2025.
80
For service-based awards, the Company uses the Black-Scholes option pricing model to measure the grant date fair
value. The Black-Scholes option pricing model incorporates several key assumptions that require significant judgment,
including the fair value of the underlying common stock, the risk-free interest rate, the expected term of the option, the
expected volatility of the Company’s common stock, and the expected dividend yield. The Black-Scholes assumptions are
summarized as follows:
•Fair value of common stock - For awards granted prior to the IPO, and given the absence of a public trading
market, the Company exercised reasonable judgment and considered a number of objective and subjective factors
to determine the best estimate of the fair value of our common stock. Factors considered for the prior grants
included, but were not limited to: (i) the results of independent third-party valuations of the Company’s common
stock; (ii) the lack of marketability of the Company’s common stock; (iii) actual operating and financial results;
(iv) current business conditions and projections; (v) the likelihood of achieving a liquidity event, such as an initial
public offering or sale of the Company, given prevailing market conditions; and (vi) precedent transactions
involving the Company’s shares. The Company has not granted stock options subsequent to the completion of the
IPO.
•Risk-free interest rate - The risk-free interest rate is calculated using the average of the published interest rates of
U.S. Treasury zero coupon issues with maturities that are commensurate with the expected term.
•Expected term - The expected term of stock options has been determined in all periods presented using the
simplified method, which uses the midpoint between the vesting date and the contractual term, as the Company’s
historical share option exercise experience does not provide a reasonable basis upon which to estimate the
expected term for service-based stock options.
•Expected volatility - Expected volatility is based on an analysis of reported data for a group of guideline publicly-
traded companies. For this analysis, the Company selects companies with comparable characteristics including
enterprise value, risk profiles, and with historical share price information sufficient to meet the expected life of the
options. The Company determines expected volatility using an average of the historical volatilities of the guideline
group of companies.
•Expected dividend yield - The expected dividend yield is based on the expected annual dividend as a percentage of
the market value of the Company’s common shares as of the grant date.
The Company recognizes forfeitures as they occur, and any previously recognized compensation expense is reversed
in the period of the forfeiture. See Note 20 - Stock Based Compensation.
In December 2023, the FASB issued ASU 2023-09 Income Taxes (“Topic 740”): Improvements to Income Tax
Disclosures Topic 740. The new guidance is intended to enhance the transparency of income tax disclosures, primarily
related to rate reconciliation and income taxes paid information. This guidance is effective for fiscal years beginning after
December 15, 2024. The guidance is effective on a prospective basis, though retrospective application is permitted. The
Company adopted ASU 2023-09 on a prospective basis for the fiscal year ended December 31, 2025, which modified our
annual disclosures but did not have a material impact on the Company’s Consolidated Financial Statements.
New Accounting Pronouncements to be Adopted
In November 2024, the FASB issued ASU 2024-03, Income Statement (Subtopic 220-40): Reporting Comprehensive
Income—Expense Disaggregation Disclosures, which enhances certain disclosure requirements related to expenses
(including purchases of inventory, employee compensation, depreciation, amortization, and depletion) in commonly
presented expense captions (such as cost of sales, selling, general and administrative expenses, and research and
development). This guidance is effective for the Company for annual periods beginning after December 15, 2026, and
interim reporting periods beginning after December 15, 2027. Early adoption is permitted. This ASU will only affect our
disclosures and will not change the expense captions the Company presents on its Consolidated Statements of
Comprehensive Income.
In July 2025, the FASB issued ASU 2025-05, Financial Instruments-Credit Losses (Topic 326). This guidance
contains amendments that provide decision-useful information to investors and other financial statement users while
81
reducing the time and effort necessary to analyze and estimate credit losses for current accounts receivable and current
contract assets. The amendments will be effective for annual reporting periods beginning after December 15, 2025, and
interim reporting periods within those annual reporting periods. Early adoption is permitted in both interim and annual
reporting periods in which financial statements have not yet been issued or made available for issuance. The Company is
evaluating the impact the new standard will have on its consolidated financial statements.
In September 2025, the FASB issued ASU 2025-06, Intangibles - Goodwill and Other - Internal-Use Software
(Subtopic 350-40): Targeted Improvements to the Accounting for Internal-Use Software, which is intended to increase the
operability of the recognition guidance considering different methods of software development. The amendments remove
all references to prescriptive and sequential software development stages (referred to as “project stages”) throughout
Subtopic 350-40, and instead specify an entity is required to start capitalizing software costs when both of the following
occur: (1) management has authorized and committed to funding the software project and (2) it is probable that the project
will be completed and the software will be used to perform the function intended (referred to as the “probable-to complete
recognition threshold”). The amendments will be effective for annual reporting periods beginning after December 15, 2027,
and interim reporting periods within those annual reporting periods. The Company is evaluating the impact the new
standard will have on its consolidated financial statements.
In December 2025, the FASB issued ASU 2025-11, Interim Reporting: Narrow-Scope Improvements, which improves
clarity for interim financial reporting requirements under the existing guidance by creating a comprehensive list of interim
disclosure requirements, clarifying scope and applicability, along with adding a principle to disclose all material events that
have occurred since the most recently filed Form 10-K. The amendments will be effective for interim reporting periods
beginning after December 15, 2027. Early adoption is permitted. The Company is evaluating the impact the new standard
will have on its consolidated financial statements and related disclosures.
Note 3 – Net Revenues
Year Ended December 31, | |||||
(in thousands) | 2025 | 2024 | 2023 | ||
North America | |||||
Equipment | $ | $ | $ | ||
Service parts | |||||
Equipment financing | |||||
Other | |||||
Total North America Net revenues | |||||
International | |||||
Equipment | |||||
Service parts | |||||
Equipment financing | |||||
Other | |||||
Total International Net revenues | |||||
Total Net revenues | $ | $ | $ | ||
Equipment and service parts
The Company offers a full line of stand-alone laundry washers and dryers and related service parts. These products
range from small residential washers and dryers to large commercial laundry equipment. Revenue from equipment and
service part sales is recognized when the Company satisfies a performance obligation by transferring control of a product to
a customer. Transfer of control generally takes place upon shipment to the customer. Revenue is measured based on the
consideration that the Company expects to be entitled to in exchange for the products transferred. Sales are generally made
82
with 30 – 120 day terms. The resulting receivables are recorded on the Consolidated Balance Sheet under Accounts
receivable, net and Accounts receivable, net - restricted for securitization investors for those receivables that are sold to a
securitization entity.
Sales incentive programs such as cash discounts, customer promotional allowances, and volume rebates are used to
promote the sale of equipment and other products. The Company estimates its variable consideration related to sales
incentive programs using the most likely amount. Revenues are recorded net of sales incentive allowances, and are based
on factors specific to each customer’s program such as expected sales volume and rebate percentages. The Company
maintains an accrual at the end of each period for the unpaid amount the customer is expected to earn related to such
programs. As of December 31, 2025 and 2024, the related accrual balances were $27.4 million and $23.1 million,
respectively. The accruals are recorded in Other current liabilities in the Consolidated Balance Sheet.
Shipping and handling costs associated with freight after control of a product has transferred to a customer are
accounted for as fulfillment costs. The Company accrues for the shipping and handling costs in the same period that the
related revenue is recognized.
The Company offers standard, limited warranties on its products. These warranties provide assurance that the product
will function as expected and are not separate performance obligations. The Company accounts for estimated warranty
costs as a liability when control of the product transfers to the customer.
The Company sells an extended warranty to its customers that is a separate performance obligation as the Company
stands by ready to perform additional warranty work not covered by the standard warranty. The Company defers the
extended warranty revenue until the period covered by the extended warranty begins, and then recognizes extended
warranty revenue ratably over the coverage period. The extended warranty contract liability was $1.4 million and $1.0
million as of December 31, 2025 and 2024, respectively.
The Company collects and remits taxes assessed by different governmental authorities that are both imposed on and
concurrent with revenue producing transactions between the Company and its customers. The Company excludes these
taxes from Net revenues.
Equipment financing
The Company offers an equipment financing program to end-customers who are primarily laundromat owners, in order
to finance their purchase of new equipment. Typical terms for equipment financing receivables range from two to twelve
Activities for further discussion regarding asset-backed financing.
Other
Other revenue consists primarily of company-owned laundromat proceeds, scrap sale and field service revenue.
Revenue from these sources is typically recognized at point of sale or when the service is performed. Additionally, other
revenue includes sales of our digital products under distinct subscription agreements. The Company records revenue for
digital product subscriptions ratably over the subscription coverage period.
Note 4 - Acquisitions
On August 1, 2025, the Company acquired certain net assets of Metropolitan Laundry Machinery Sales Inc.
("Metropolitan Laundry"), a leading distributor of laundry equipment headquartered in South Richmond Hill, New York,
servicing the metro New York area. Prior to the acquisition, the Company had a preexisting relationship with Metropolitan
Laundry in the normal course of business. At the acquisition date, the Company had a receivable of $1.1 million that was
settled in connection with the acquisition. The purchase price allocation for this acquisition is complete.
On October 1, 2024, the Company paid cash to acquire certain net assets of Bestway Distributing Company
(“Bestway”), a leading distributor of on-premise laundry equipment in Corona, California. Prior to the acquisition, the
Company had a preexisting relationship with Bestway in the normal course of business. At the acquisition date, the
Company had a receivable of $0.2 million that was settled in connection with the acquisition.
83
On September 1, 2024, the Company paid cash to acquire certain net assets of L&R Laundry, LLC DBA Alliance
Laundry Equipment (“L&R Laundry”), a premier provider of solutions for on-premise laundries and laundromats,
headquartered in Salt Lake City, Utah. Prior to the acquisition, the Company had a preexisting relationship with L&R
Laundry in the normal course of business. At the acquisition date, the Company had a receivable of $2.1 million that was
settled in connection with the acquisition.
On July 1, 2024, the Company paid cash to acquire certain net assets of Star Distributing Commercial Laundry
Equipment, Inc. (“Star Distributing”), a leader in providing solutions for on-premise laundries, laundromats, and multi-
housing applications and its parts business in Nashville, Tennessee. Prior to the acquisition, the Company had a preexisting
relationship with Star Distributing in the normal course of business. At the acquisition date, the Company had a receivable
of $1.1 million that was settled in connection with the acquisition.
On November 1, 2023 the Company paid cash to acquire certain net assets of Statewide Machinery, Inc. (“Statewide”),
a leader in providing solutions for on-premise laundries, laundromats, and multi-housing applications in Northern
Pennsylvania, as well as Buffalo, Syracuse, Rochester and Albany, New York and is headquartered in Batavia, New York.
Prior to the acquisition, the Company had a preexisting relationship with Statewide in the normal course of business. At the
acquisition date, the Company had a receivable of $1.5 million that was settled in connection with the acquisition.
On July 1, 2023, the Company paid cash to acquire certain net assets of Dynamic Laundry Systems, Inc. (“DSS”), a
distributor with more than three decades of experience in providing commercial laundry solutions in the Pacific Northwest
and is headquartered in Kirkland, Washington. Prior to the acquisition, the Company had a preexisting relationship with
DSS in the normal course of business. At the acquisition date, the Company had a receivable of $0.6 million that was
settled in connection with the acquisition.
On April 1, 2023, the Company paid cash to acquire certain net assets of Taylor Houseman, Inc. (“Taylor Houseman”),
distributor with more than two decades of experience in providing commercial laundry solutions in the Northern California
area and is headquartered in Pittsburg, California. Prior to the acquisition, the Company had a preexisting relationship with
Taylor Houseman in the normal course of business. At the acquisition date, the Company had a receivable of $0.03 million
that was settled in connection with the acquisition.
and liabilities assumed as of the acquisition date for these acquisitions.
Year Ended December 31, | |||||
(in thousands) | 2025 | 2024 | 2023 | ||
Total purchase price | $ | $ | $ | ||
Allocation of purchase price: | |||||
Assets acquired: | |||||
Accounts receivables | |||||
Inventories, net | |||||
Property, plant, and equipment, net | |||||
Intangible assets - customer relationships | |||||
Total assets acquired | $ | $ | $ | ||
Total liabilities assumed | |||||
Total net assets acquired | $ | $ | $ | ||
Goodwill | |||||
Total purchase price allocation | $ | $ | $ | ||
Goodwill and Intangible assets related to acquisitions are included in the North America reportable segment and are
deductible for tax purposes over a 15 year period. The acquired customer relationship intangible assets acquired in 2025
were assigned a useful life of six years . The useful life assigned to customer relationship intangible assets acquired in 2024
84
and 2023 was seven years
benefits expected be realized.
From the date of acquisition through December 31, 2025, the Consolidated Statements of Comprehensive Income
reflected contributions from companies acquired during the year of approximately $4.3 million in Net revenues. From the
date of acquisition through December 31, 2024, the Consolidated Statements of Comprehensive Income reflected
contributions from companies acquired during the year of approximately $8.2 million in Net revenues. From the date of
acquisition through December 31, 2023, the Consolidated Statements of Comprehensive Income reflected contributions
from companies acquired during the year of approximately $10.8 million in Net revenues. The acquisitions completed in
Note 5 - Other Expenses, net
Comprehensive Income.
Year Ended December 31, | |||||
(in thousands) | 2025 | 2024 | 2023 | ||
Foreign exchange losses/(gains) on intercompany loans | $ | $( | $ | ||
Debt issuance cost write-offs and amendment expenses | |||||
Non-service components of net periodic pension expense | |||||
Pension settlement loss | |||||
Other expenses, net | $ | $ | $ | ||
Foreign exchange losses/(gains) on intercompany loans result from intercompany loans where the lender or borrower’s
functional currency differs from the loan denomination currency.
During 2023, the Company completed termination proceedings for the pension plan and recognized a settlement loss
of $7.0 million for the year ended December 31, 2023. See Note 17 - Pensions and Other Employee Benefits for further
information.
Note 6 - Asset Backed Facilities
Securitized Equipment Financing
The Company maintains an internal financing organization primarily to assist end-user laundromat locations in
financing Company-branded equipment through the Company’s distributors in the United States and Canada. Alliance
Laundry originates and administers the sale of equipment financing receivables through a special-purpose bankruptcy
remote subsidiary, Alliance Laundry Equipment Receivables 2015 LLC (“ALER 2015”), and a trust (a qualified special
purpose entity or “QSPE”), Alliance Laundry Equipment Receivables Trust 2015-A (“ALERT 2015A”). These transactions
are financed by a revolving credit facility (the “Asset Backed Equipment Facility”) backed by equipment financing
receivables originated by the Company. Alliance Laundry is permitted, from time to time, to sell certain equipment
financing receivables to its special-purpose subsidiary, which in turn transfers them to the trust.
On June 30, 2022 the Company entered the Seventh Amendment to the Asset Backed Equipment Facility to extend the
term of the agreement until June 30, 2025. As a result, the Company incurred $1.2 million of fees which were capitalized
and included in Debt issuance costs, net in the Consolidated Balance Sheets. These costs were being amortized over the
into an agreement to increase the facility limit from a lender committed amount of $430.0 million to $460.0 million.
On May 1, 2025, the Company entered into an amendment to the Asset Backed Equipment Facility to increase the
facility limit from a lender committed amount of $460.0 million to $500.0 million, with an additional uncommitted increase
of $30.0 million available. The amendment extended the term until May 1, 2028. As a result, the Company incurred $1.6
million of fees which were capitalized and included in Debt issuance costs, net line of the Consolidated Balance Sheets.
These costs are being amortized over the three-year life of the facility, which approximates the effective interest method.
85
On December 29, 2025, the Company entered into an agreement (the "Facility Limit Increase Agreement") to convert
the lender uncommitted amount of $30.0 million, which increased the lender committed amount under the Asset Backed
Equipment Facility from $500.0 million to $530.0 million. As a result, the Company incurred $0.1 million of fees which
were capitalized and included in Debt issuance costs, net in the Consolidated Balance Sheets. These costs are being
amortized over the three-year life of the facility, which approximates the effective interest method.
The trust finances the acquisition of equipment financing receivables through borrowings under the Asset Backed
Equipment Facility in the form of funding notes which are limited to an advance rate of approximately 88 %. Additional
advances under the Asset Backed Equipment Facility are subject to certain continuing conditions, including but not limited
to: (i) covenant restrictions relating to the weighted average life, weighted average interest rate and the amount of fixed rate
equipment financing receivables held by the trust; (ii) the absence of a rapid amortization event or event of default, as
defined; (iii) the Company’s compliance, as servicer, with certain financial covenants and (iv) no event having occurred
which materially and adversely affects the Company’s operations.
The risk of loss to the note purchasers under the Asset Backed Equipment Facility resulting from default or dilution on
equipment financing receivables is mitigated by credit enhancement provided by the Company in the form of cash reserves
and over-collateralization. The Company also retains the servicing rights and receives a monthly servicing fee for the
equipment financing receivables sold at a 1.0 % annual rate of the aggregate balance of such equipment financing
receivables.
Under the Asset Backed Equipment Facility, interest payments on the variable funding notes are paid monthly at an
interest rate equal to the daily simple SOFR (“Secured Overnight Financing Rate”) rate plus a margin of 120 basis points,
which was equivalent to 5.0 % at December 31, 2025. If an event of default occurs, the otherwise applicable interest rate for
the Asset Backed Equipment Facility will be increased by an amount equal to 200 basis points per annum. The lenders also
earn an unused facility fee of 0.35 % of the unfunded portion of each lender's commitment amount prior to a rapid
amortization event or event of default.
After May 1, 2028, the trust will not be permitted to request new borrowings, and the outstanding borrowings will
amortize over a period of two and a half years with any remaining balance due at maturity.
The equipment financing receivables typically have interest rates ranging primarily from Prime plus 0.0 % to Prime
plus 4.75 % for variable rate equipment financing receivables and 3.75 % to 11.50 % for fixed-rate equipment financing
receivables. The average interest rate for all equipment financing receivables at December 31, 2025 was 8.43 % with terms
ranging primarily from two to twelve years . The weighted-average remaining expected life of equipment financing
receivables held by the trust was approximately 3.42 years at December 31, 2025. All equipment financing receivables
allow the holder to prepay outstanding principal amounts without penalty.
Securitized Receivables Financing
Alliance Laundry, through a special-purpose bankruptcy remote subsidiary, Alliance Laundry Trade Receivables LLC
(“ALTR LLC”), utilizes a revolving credit facility (the “Asset Backed Trade Receivables Facility”) backed by trade
receivables originated by the Company. Under the Asset Backed Trade Receivables Facility, Alliance Laundry originates
and simultaneously sells its trade receivables to its special-purpose subsidiary. The risk of loss to the trade receivables
under the Asset Backed Trade Receivables Facility resulting from default or dilution on trade receivables is mitigated by
credit enhancement provided by the Company in the form of over-collateralization.
On June 30, 2022, the Company entered an amendment to the Asset Backed Trade Receivables Facility to extend the
term of the agreement until June 30, 2025, and increase the facility limit of $100.0 million to $120.0 million. The Company
incurred $0.3 million of fees in connection with the amendment which were capitalized and included in Debt issuance
costs, net in the Consolidated Balance Sheets. These costs were amortized over three-year revolving life of the facility,
which approximates the effective interest method.
On May 1, 2025, the Company entered into an amendment to the Asset Backed Trade Receivables Facility, which
extended the term of the agreement until May 1, 2028. The Company incurred $0.3 million of fees in connection with the
amendment which were capitalized and included in the Debt issuance costs, net line of the Consolidated Balance Sheets.
These costs are being amortized over the three-year revolving life of the facility, which approximates the effective interest
method.
86
Under the Asset Backed Trade Receivables Facility, interest payments on the variable funding notes are paid monthly
at an interest rate equal to the daily 1-month SOFR rate plus a margin of 110 basis points, which was 4.8 % as of
December 31, 2025. The lender also earns an unused facility fee of 0.35 % of the unfunded portion of each lender’s
commitment amount.
After May 1, 2028, ALTR LLC will not be permitted to request new borrowings, and the outstanding borrowings will
amortize over 180 days with any remaining balance due at maturity.
Additional advances under the Asset Backed Facilities are subject to certain continuing conditions, including but not
limited to: (i) covenant restrictions relating to the weighted average life, weighted average interest rate and the amount of
fixed rate equipment financing receivables held by the trust; (ii) the absence of a rapid amortization event or event of
default, as defined; (iii) the Company’s compliance, as servicer, with certain financial covenants and (iv) no event having
occurred which materially and adversely affects the Company’s operations.
The variable funding notes issued under the Asset Backed Facilities will commence amortization, and borrowings
under the Asset Backed Facilities will cease prior to the end of the Revolving Period, or May 1, 2028, upon the occurrence
of certain “rapid amortization events” which include: (i) a borrowing base shortfall exists and remains uncured; (ii)
delinquency, dilution, or default ratios on pledged receivables and equipment financing receivables exceeding certain
specified ratios in any given month; (iii) the days sales outstanding on receivables exceed a specified number of days; (iv)
the occurrence and continuance of an event of default or servicer default under the Asset Backed Facilities, including but
not limited to, as servicer, a material adverse change in our business or financial condition and the Company’s compliance
with certain required financial covenants; and (v) a number of other specified events. As of December 31, 2025, no rapid
amortization events have occurred.
All the residual beneficial interests in the trust and ALTR LLC and cash flows remaining from the pool of receivables
after payment of all obligations under the Asset Backed Facilities will accrue to the benefit of Alliance Laundry. The
Company provides no support or recourse for the risk of loss relating to default on the assets transferred to the trust and
ALTR LLC except for the retained interests and amounts of the letters of credit outstanding from time to time as credit
enhancement.
The Company follows accounting standards relating to the consolidation of variable interest entities and accounting for
transfers of financial assets. In evaluating the variable interest entity accounting guidance, the Company evaluated if the
trust should be consolidated. The Company has concluded that it is the primary beneficiary of the trust as (1) it has the
power to direct the activities of the trust that most significantly impact the trust's economic performance and (2) the
Company has the obligation to absorb losses or the right to receive benefits that could potentially be significant to the trust.
As a result, the Company consolidates the trust in our financial statements.
Note 7 - Securitization Activities
The following lines of the Company’s Consolidated Balance Sheets are specific to the Company’s securitization and
are restricted for securitization investors only:
•Restricted cash - for securitization investors
•Accounts receivable, net - restricted for securitization investors
•Equipment financing receivables, net - restricted for securitization investors (current and long-term)
•Asset backed borrowings - owed to securitization investors (current and long-term)
Certain aspects of the Company’s retained interest in the assets of the trust constitute intercompany positions which are
eliminated in the preparation of the Company’s Consolidated Balance Sheets. Trust receivables underlying the Company’s
retained interest are recorded in Accounts receivable, net - restricted for securitization investors and Equipment financing
receivables, net - restricted for securitization investors.
Restricted Cash - for Securitization Investors
To protect the noteholders of the trust, additional collateral in the form of a cash reserve equal to 1.0 % of the
equipment financing receivable balances is maintained as well as a yield account for lower fixed rate loans. Additionally,
87
collection accounts to facilitate the collection and disbursement of funds are maintained separately for accounts receivable
and equipment financing receivables. The following table presents the components of restricted cash for securitization
investors.
(in thousands) | December 31, 2025 | December 31, 2024 | |
Cash reserve accounts | $ | $ | |
Collection accounts - accounts receivable | |||
Collection accounts - equipment financing receivables | |||
Restricted cash - for securitization investors | $ | $ |
Securitization Activities
The Company transfers accounts receivable and equipment financing receivables to its special-purpose bankruptcy
remote subsidiaries in the ordinary course of business as part of its ongoing securitization activities. The Company receives
a combination of cash and residual interests in the transferred assets in its securitization transactions.
investors.
(in thousands) | December 31, 2025 | December 31, 2024 | |
Accounts receivable - restricted for securitization investors | $ | $ | |
Less: Allowance for accounts receivable credit losses | ( | ( | |
Accounts receivable, net - restricted for securitization investors | |||
Less: Asset backed borrowings - owed to securitization investors | ( | ( | |
Company's residual interest in securitized accounts receivable | $ | $ |
The following table presents the Company’s residual interests in Equipment financing receivables, net - restricted for
securitization investors.
December 31, 2025 | December 31, 2024 | ||||||
(in thousands) | Current | Long-term | Current | Long-term | |||
Equipment financing receivables - restricted for securitization investors | $ | $ | $ | $ | |||
Less: Allowance for equipment financing receivables credit losses | ( | ( | ( | ( | |||
Equipment financing receivables, net - restricted for securitization investors | |||||||
Less: Asset backed borrowings - owed to securitization investors | ( | ( | ( | ( | |||
Company's residual interest in securitized equipment financing receivables | $ | $ | $ | $ | |||
88
Asset Backed Borrowings - Owed to Securitization Investors
The asset backed borrowings owed to securitization investors in the Company’s Consolidated Balance Sheets
represents the third-party noteholders’ interest in accounts receivable and equipment financing receivables. The following
table presents the future minimum payments on asset backed borrowings.
Year | Related to Trade Receivables | Related to Equipment Financing Receivables | Total Securitization Debt | ||
2026 | $ | $ | $ | ||
2027 | |||||
2028 | |||||
2029 | |||||
2030 | |||||
Thereafter | |||||
Securitization Debt | $ | $ | $ |
Credit Quality of Equipment Financing Receivables
Past due balances of equipment financing receivables represent the principal balance of loans and leases held with any
payment amounts between 30 and 89 days past the contractual payment due date. Non-performing equipment financing
receivables represent loans and leases that are generally more than 89 days delinquent. Non-performing receivables are
included in the estimate of expected credit losses. The allowance is measured on a collective basis for equipment financing
receivables with similar risk characteristics. The Company does not accrue interest income on non-performing equipment
financing receivables. Finance income for non-performing equipment financing receivables is recognized on a cash basis.
89
performing and current equipment financing receivables by class and vintage:
December 31, 2025 | 2025 | 2024 | 2023 | 2022 | 2021 | Prior | Total | |||||||
Securitized | ||||||||||||||
Current | $ | $ | $ | $ | $ | $ | $ | |||||||
30-59 Days | ||||||||||||||
60-89 Days | ||||||||||||||
Total past due accruing | ||||||||||||||
Over 89 Days non-performing | ||||||||||||||
Total Securitized | $ | $ | $ | $ | $ | $ | $ | |||||||
Current period gross charge-offs | $ | $ | $ | $ | $ | $ | $ | |||||||
Unsecuritized | ||||||||||||||
Current | $ | $ | $ | $ | $ | $ | $ | |||||||
30-59 Days | ||||||||||||||
60-89 Days | ||||||||||||||
Total past due accruing | ||||||||||||||
Over 89 Days non-performing | ||||||||||||||
Total Unsecuritized | $ | $ | $ | $ | $ | $ | $ | |||||||
Current period gross charge-offs | $ | $ | $ | $ | $ | $ | $ |
December 31, 2024 | 2024 | 2023 | 2022 | 2021 | 2020 | Prior | Total | |||||||
Securitized | ||||||||||||||
Current | $ | $ | $ | $ | $ | $ | $ | |||||||
30-59 Days | ||||||||||||||
60-89 Days | ||||||||||||||
Total past due accruing | ||||||||||||||
Over 89 Days non-performing | ||||||||||||||
Total Securitized | $ | $ | $ | $ | $ | $ | $ | |||||||
Current period gross charge-offs | $ | $ | $ | $ | $ | $ | $ | |||||||
Unsecuritized | ||||||||||||||
Current | $ | $ | $ | $ | $ | $ | $ | |||||||
30-59 Days | ||||||||||||||
60-89 Days | ||||||||||||||
Total past due accruing | ||||||||||||||
Over 89 Days non-performing | ||||||||||||||
Total Unsecuritized | $ | $ | $ | $ | $ | $ | $ | |||||||
Current period gross charge-offs | $ | $ | $ | $ | $ | $ | $ |
The Company elected to exclude accrued interest receivable from the amortized cost basis. At December 31, 2025 and
2024, accrued interest was $2.3 million and $2.2 million, respectively, which we report in Prepaid expenses and other
current assets in the Consolidated Balance Sheets. The Company’s securitized equipment financing receivable losses, on a
90
total portfolio basis, as a percentage of average balances outstanding were 0.2 %, 0.2 % and 0.1 % for each of the years
ended December 31, 2025, 2024 and 2023.
on the Consolidated Balance Sheets.
(in thousands) | Balance at Beginning of Period | Current Period Provision | Actual Write-Off’s | Recoveries | Impact of Foreign Exchange Rates | Balance at End of Period | |||||
Unsecuritized Equipment Financing Receivables Portfolio | |||||||||||
Period ended: | |||||||||||
December 31, 2025 | $ | ( | $ | ||||||||
December 31, 2024 | $ | ( | ( | $ | |||||||
December 31, 2023 | $ | ( | $ | ||||||||
Securitized Equipment Financing Receivables Portfolio - restricted for securitization investors | |||||||||||
Period ended: | |||||||||||
December 31, 2025 | $ | ( | $ | ||||||||
December 31, 2024 | $ | ( | $ | ||||||||
December 31, 2023 | $ | ( | $ |
Other Trust Items
The Company incurred $1.9 million of capitalized debt issuance costs, associated with the refinancing of Asset Backed
Facilities in 2025. The following table presents the amortization expense and extinguishment of debt issuance costs.
Year Ended December 31, | |||||
(in thousands) | 2025 | 2024 | 2023 | ||
Amortization expense and extinguishment of debt issuance costs | $ | $ | $ | ||
Note 8 - Inventories
(in thousands) | 2025 | 2024 | |
Finished goods | $ | $ | |
Raw materials | |||
Work in process | |||
Inventories, net | $ | $ |
91
Note 9 - Property, Plant and Equipment
(in thousands) | 2025 | 2024 | ||
Land | $ | $ | ||
Buildings and leasehold improvements | ||||
Finance leases | ||||
Machinery and equipment | ||||
Less: accumulated depreciation | ( | ( | ||
Construction in progress | ||||
Total Property, plant and equipment, net | $ | $ |
Depreciation expense was $42.0 million, $39.7 million and $38.6 million for the years ended December 31, 2025,
2024 and 2023, respectively.
Note 10 - Leases
We lease certain property, information technology equipment, warehouse equipment, vehicles and other equipment
through operating leases. We recognize a lease liability and corresponding right-of-use (“ROU”) asset based on the present
value of lease payments. Our lease agreements may include options to extend or terminate the lease. When it is reasonably
certain that we will exercise an option, we include the option in the recognition of ROU assets and lease liabilities. The
Company used the short-term lease practical expedient which permits the Company to not capitalize leases with a term
equal to or less than 12 months.
The Company has elected the practical expedient to include fixed non-lease components of lease payments for the
purpose of calculating lease right-of-use assets and liabilities. Non-lease components that are not fixed are expensed as
incurred as variable lease payments.
The Company’s lease agreements do not provide an implicit rate to determine the present value of lease payments. As
such, the Company uses its incremental borrowing rate to determine the present value of lease payments. The Company
derives its incremental borrowing rate from information available at the lease commencement date, which represents a
collateralized rate of interest the Company would have to pay to borrow over a similar term an amount equal to the lease
payments in a similar economic environment.
We sublease certain real estate to third parties. Our sublease portfolio consists of operating leases, resulting in a
nominal amount of sublease income for the year ended December 31, 2025, 2024 and 2023.
(in thousands) | December 31, 2025 | December 31, 2024 | December 31, 2023 | ||
Operating lease expense | $ | $ | $ | ||
Variable lease expense | |||||
Short-term lease expense | |||||
Total Operating lease expense | $ | $ | $ |
The variable lease expenses generally include common area maintenance, property taxes and mileage.
92
(in thousands) | December 31, 2025 | December 31, 2024 | |
Operating Leases | |||
Operating lease right-of-use assets | $ | $ | |
Current liabilities | $ | $ | |
Long-term liabilities | $ | $ | |
Weighted average remaining lease term | |||
Operating leases | |||
Weighted Average discount rates | |||
Operating leases |
(in thousands) | December 31, 2025 | December 31, 2024 | December 31, 2023 | ||
Cash paid for amounts included in the measurement of Operating lease liabilities | $ | $ | $ | ||
Operating lease ROU assets obtained in the exchange for Operating lease liabilities | $ | $ | $ |
(in thousands) | December 31, 2025 |
Amounts Due In | |
2026 | $ |
2027 | |
2028 | |
2029 | |
2030 | |
Thereafter | |
Total lease payments | |
Less: Imputed interest | ( |
Total | $ |
93
Note 11 - Goodwill and Other Intangibles
Other Intangibles
(in thousands) | Gross Amount | Accumulated Amortization | Net Amount | Weighted Average Life Remaining | |||
Identifiable intangible assets: | |||||||
Trademarks and tradenames, indefinite lives | $ | $— | $ | Indefinite | |||
Trademarks and tradenames, definite lives | |||||||
Customer agreements and distributor network | |||||||
Engineering and manufacturing designs and processes | |||||||
Patents | |||||||
Computer software and other | |||||||
$ | $ | $ |
The Company’s trademarks and tradenames have renewal terms and the costs to renew these intangible assets are
expensed as incurred. At December 31, 2025, the trademarks have a weighted average time until the next renewal of 4.73
years.
(in thousands) | Gross Amount | Accumulated Amortization | Net Amount | Weighted Average Life Remaining | |||
Identifiable intangible assets: | |||||||
Trademarks and tradenames, indefinite lives | $ | $— | $ | Indefinite | |||
Trademarks and tradenames, definite lives | |||||||
Customer agreements and distributor network | |||||||
Engineering and manufacturing designs and processes | |||||||
Patents | |||||||
Computer software and other | |||||||
$ | $ | $ |
The Company’s indefinite-lived intangible assets are the Speed Queen, Huebsch and UniMac trademarks. The
trademarks were determined to have an indefinite useful life as the Company expects to continue to use these assets for the
foreseeable future.
The indefinite-lived trademarks are tested for impairment at least annually and more frequently if an event occurs
which indicates the intangible asset may be impaired. The Company performs the annual impairment test of its indefinite-
lived intangible assets on October 1 of each year and more frequently if an event occurs which indicates intangible assets
may be impaired. The impairment test consists of a comparison of the fair value of the intangible asset with its carrying
value amount. An impairment loss is recognized if the carrying amount of an intangible asset exceeds its fair value in an
amount equal to that excess, but not to exceed the carrying amount of the intangible asset. The fair value of the tradenames
and trademarks is determined with the assistance of a third party using the relief-from-royalty method.
Based on the impairment tests, the Company did not
2025, 2024 and 2023 as the fair values of the Speed Queen, UniMac, and Huebsch trademarks were in excess of their
carrying values as of December 31, 2025, 2024 and 2023.
94
Year Ended December 31, | |||||
(in thousands) | 2025 | 2024 | 2023 | ||
Amortization expense | $ | $ | $ | ||
Estimated amortization expense for existing definite-lived intangible assets beginning in 2026 is expected to be
approximately $49.6 million, $49.3 million, $47.7 million, $45.3 million and $44.9 million for each of the years in the
succeeding five-year period ending December 31, 2030. Estimated amortization expense can be affected by various factors
including future acquisitions or divestitures of trademark, licensing or distribution rights.
Goodwill
reporting unit is included within the North America reportable segment. The Europe, Asia, and Middle East & Africa
reporting units are included within the International reporting segment. There has been no goodwill allocated to the Retail
Operations or Latin America reporting units, therefore these reporting units have been excluded from this presentation.
(in thousands) | North America | Europe | Asia | Middle East & Africa | Consolidated | ||||
Balance, December 31, 2023⁽¹⁾ | $ | $ | $ | $ | $ | ||||
Goodwill acquired | |||||||||
Measurement period adjustments | ( | ( | |||||||
Currency translation | ( | ( | ( | ( | |||||
Balance, December 31, 2024⁽¹⁾ | $ | $ | $ | $ | $ | ||||
Goodwill acquired | |||||||||
Measurement period adjustments | ( | ( | |||||||
Currency translation | |||||||||
Balance, December 31, 2025⁽¹⁾ | $ | $ | $ | $ | $ |
_____________________
(1)The carrying amount of goodwill is presented net of accumulated impairment losses of $112.5 million, $95.8 million and $104.1 million as of
December 31, 2025, 2024 and 2023, respectively.
On October 1 of each year, and more frequently if an event occurs which indicates goodwill may be impaired, the
Company performs an annual impairment test of its goodwill. Based on the impairment tests, the Company did not
an impairment charge for the years ended December 31, 2025, 2024 or 2023.
Note 12 - Derivative Financial Instruments
Derivative instruments are accounted for at fair value. The accounting for changes in the fair value of a derivative
depends on the intended use, designation and type of the derivative instrument. The Company does not designate any of its
derivatives as hedges and, as such, records all changes in fair values as a component of earnings.
Using derivative instruments means assuming counterparty credit risk. Counterparty credit risk relates to the loss the
Company could incur if a counterparty were to default on a derivative contract. The Company primarily deals with
investment grade counterparties and monitors its overall credit risk and exposure to individual counterparties. The
Company does not anticipate nonperformance by any counterparties. The amount of counterparty credit exposure is the
unrealized gains, if any, on such derivative contracts. The Company does not require, nor does it post collateral, or security,
on such contracts.
The Company is exposed to certain risks relating to its ongoing business operations. As a result, the Company enters
into derivative transactions to manage these exposures. The primary risks managed through the use of derivative
instruments are fluctuations in interest rates, foreign currency exchange rates and commodity prices. Fluctuations in these
rates and prices can affect the Company’s operating results and financial condition. The Company manages the exposure to
95
these market risks through operating and financing activities and through the use of derivative financial instruments. The
Company does not enter into derivative financial instruments for trading or speculative purposes.
Interest Rate Risk
Borrowings outstanding under the Term Loan totaled $1,365.0 million at December 31, 2025. Borrowings under the
Term Loan bear interest, at the option of Alliance Laundry, at a rate equal to an applicable margin plus (a) the adjusted
base rate or (b) the term SOFR (both rates as defined in the Credit Agreement). The applicable margins for the Term Loan
are currently 1.25 % with respect to adjusted base rate loans and 2.25 % with respect to term SOFR loans. An assumed 10%
increase/decrease in the SOFR interest rate in effect at December 31, 2025 would increase/decrease annual interest expense
by $2.3 million on the non-hedged portion of the borrowing.
Effective September 3, 2024, the Company entered into a $600.0 million interest rate swap agreement to hedge a
portion of our interest rate risk related to our long-term borrowings. Under the swap, which matures on September 1, 2027,
the Company pays a fixed rate of 3.61 % and receives or pays monthly interest payments based upon a comparison to the
one-month SOFR rate.
Effective April 1, 2025, the Company entered into a $150.0 million interest rate swap agreement to hedge a portion of
our interest rate risk related to our long-term borrowings. Under the swap, which matures on April 3, 2028, the Company
pays a fixed rate of 3.36 % and receives or pays monthly interest payments based upon a comparison to the one-month
SOFR rate.
Interest rate caps are in place as part of the Asset Backed Facilities to limit the Company’s exposure to interest rate
increases which may adversely affect the overall performance of the Company’s equipment financing activities. The
interest rate cap strike rates are 5.19 %, 5.00 % and 7.00 %.
Foreign Currency Risk
The Company has manufacturing, sales, and distribution facilities in the Czech Republic, China and Thailand. The
Company also has various sales and distribution facilities in Brazil, France, Spain, Italy, Germany and the United Arab
Emirates. The Company also makes investments and enters into transactions denominated in foreign currencies. The vast
majority of the Company’s international sales from its domestic operations are denominated in U.S. dollars. However, the
Company is exposed to transactional and translational foreign exchange risk related to its foreign operations.
Regarding transactional foreign exchange risk, the Company from time to time enters into certain forward exchange
contracts to reduce the variability of the earnings and cash flow impacts of foreign denominated receivables and payables.
The Company does not designate these contracts as hedge transactions. Accordingly, the mark-to-market impact of these
contracts is recorded each period to current earnings. At December 31, 2025, and 2024, the Company had no
foreign currency contracts.
The Company’s primary translation exchange risk exposures at December 31, 2025 were the euro, Czech koruna, and
Thai baht. Amounts invested in non-U.S. based subsidiaries are translated into US dollars at the exchange rate in effect at
period end. The resulting translation adjustments are recorded in accumulated other comprehensive income/(loss) as
foreign currency translation adjustments.
Commodity Risk
The Company is subject to the effects of changing raw material and component costs caused by movements in
underlying commodity prices. The Company purchases raw materials and components containing various commodities
including nickel, zinc, aluminum and copper. The Company generally buys these raw materials and components based
upon market prices that are established with the vendor as part of the procurement process.
96
From time to time, the Company enters into contracts with its vendors to lock in commodity prices for various periods
to limit its near-term exposure to fluctuations in raw material and component prices. In addition, the Company enters into
commodity forward contracts, for commodities such as nickel, copper and aluminum, to reduce the variability on its
earnings and cash flows of purchasing raw materials containing such commodities. The Company does not designate these
contracts as hedge transactions. Accordingly, the mark-to-market impacts of these contracts are recorded each period to
current earnings. At December 31, 2025, the Company was managing $3.1 million notional value of nickel forward
contracts and less than $0.1 million of copper forward contracts. At December 31, 2024, the Company was managing $1.7
million notional value of nickel forward contracts.
The Company presents its derivatives at gross fair values in the Consolidated Balance Sheets and does not maintain
derivative contracts which would require financial instrument or collateral balances. The following tables summarize the
fair value of the Company’s outstanding derivative contracts included within the Consolidated Balance Sheets.
December 31, 2025 Fair Value (Level 2) | Location on Balance Sheet | Term | ||||||||
(in thousands) | Notional Amount | Liabilities | ||||||||
Undesignated derivatives: | ||||||||||
Interest rate swap | $ | $ | $ | Other current liabilities and long-term liabilities | Various through 4/3/2028 | |||||
Commodity hedges | Prepaid expenses and other current assets and Other current liabilities | Various through 1/5/27 | ||||||||
Interest rate cap | Other long-term assets | Various through 9/15/31 | ||||||||
Total undesignated derivatives | $ | $ | ||||||||
December 31, 2024 Fair Value (Level 2) | Term | |||||||||
(in thousands) | Notional Amount | Assets | Location on Balance Sheet | |||||||
Undesignated derivatives: | ||||||||||
Interest rate swap | $ | $ | $ | Prepaid expenses and other current assets and Other assets | Through 9/1/27 | |||||
Commodity hedges | Other current liabilities | Various through 12/31/25 | ||||||||
Interest rate cap | Other long-term assets | Various through 9/15/31 | ||||||||
Total undesignated derivatives | $ | $ | ||||||||
Consolidated Statements of Comprehensive Income.
Gain/(Loss) Recognized on Undesignated Derivatives | ||||||||
(in thousands) | Location in Consolidated Statements of Comprehensive Income | Year Ended December 31, | ||||||
Undesignated Derivatives | 2025 | 2024 | 2023 | |||||
Interest rate swap | Interest expense, net | $( | $ | $ | ||||
Foreign currency hedges | Cost of sales | ( | ||||||
Commodity hedges | Cost of sales | ( | ( | |||||
Interest rate cap | Interest expense, net | ( | ||||||
$( | $ | $ | ||||||
Changes in the fair value of the derivative contracts are included as a non-cash adjustment to net income in the
operating activities section in the Consolidated Statements of Cash Flows.
97
Note 13 - Fair Value Measurements
The fair value of the Company’s term debt approximates carrying amounts. As of December 31, 2025 and 2024, the
Company’s fair value of long-term debt was $1,368.4 million and $2,085.4 million, respectively, using Level 2 inputs.
Derivatives are recorded at fair value based upon third-party quotes, see Note 12 - Derivative Financial Instruments
for further information.
Note 14 - Other Current Liabilities
(in thousands) | December 31, 2025 | December 31, 2024 | |
Salaries, wages and other employee benefits | $ | $ | |
Product warranties | |||
Accrued interest | |||
Accrued sales incentives | |||
Income taxes | |||
Other current liabilities | |||
$ | $ |
Note 15 - Income Taxes
The Company uses the asset and liability method of accounting for income taxes whereby deferred income taxes are
recorded for the future tax consequences attributable to differences between the financial statement and tax bases of assets
and liabilities. Deferred income tax assets and liabilities are measured using tax rates expected to apply to taxable income
in the years in which those temporary differences are expected to be recovered or settled. Deferred income tax assets and
liabilities are revalued to reflect new tax rates during the periods in which rate changes are enacted. Management believes,
based on the operating earnings in prior years, expected reversals of taxable temporary differences and reliance on future
earnings, that it is more likely than not that the majority of the recorded net deferred tax assets are fully realizable.
There are various factors that may cause the Company’s tax assumptions to change in the near term and as a result the
Company may have to increase or decrease its valuation allowance against net deferred income tax assets. The Company
assesses the impact of significant changes to the U.S. federal, foreign and state income tax laws and regulations on a
regular basis and updates the assumptions and estimates used to prepare its Consolidated Financial Statements when new
regulations and legislation are enacted.
Year Ended December 31, | |||||
(in thousands) | 2025 | 2024 | 2023 | ||
Domestic | $ | $ | $ | ||
Foreign | |||||
$ | $ | $ | |||
98
(in thousands) | December 31, 2025 | December 31, 2024 | December 31, 2023 | ||
Current: | |||||
Federal | $ | $ | $ | ||
State | |||||
Foreign | |||||
Total current | |||||
Deferred: | |||||
Federal | ( | ( | ( | ||
State | ( | ( | ( | ||
Foreign | ( | ( | ( | ||
Total deferred | ( | ( | ( | ||
Provision for income taxes | $ | $ | $ |
ASU 2023-09, which has been adopted prospectively, requires the disaggregation of cash income tax payments. Our
cash income tax payments in 2025 were as follows:
(In thousands) | Year Ended December 31, 2025 |
U.S. federal | $ |
State: | |
Other | |
State subtotal | |
Foreign: | |
Czech Republic | |
Other | |
Foreign subtotal | |
Total income taxes paid | $ |
99
The Company has elected to prospectively adopt the guidance in ASU No. 2023-09, Income Taxes (Topic 740):
Improvements to Income Taxes Disclosures. The following table presents the reconciliation between tax expense at the
U.S. federal statutory income tax rate and the effective income tax rate for income before taxes after the Company's
adoption of ASU 2023-09:
(In thousands) | Year Ended December 31, 2025 | ||
US Federal Statutory Income Tax Rate | $ | ||
Domestic State and Local Income Taxes, net of federal effect* | |||
Domestic Federal | |||
Tax Credits | |||
Foreign Tax Credit | ( | ( | |
Other | ( | ( | |
Changes in valuation allowance - Foreign Tax Credit | |||
Nontaxable and Nondeductible Items | |||
Excess tax benefits of stock-based payments | ( | ( | |
Officers compensation limitation - IRC Section 162(m) | |||
Other | |||
Cross-Border Tax Laws | |||
Other | |||
Other | |||
Foreign Tax Effects | |||
Brazil | |||
Czech Republic | |||
Luxembourg | |||
Changes in valuation allowance | ( | ( | |
Changes in net operating losses | |||
Other | |||
Thailand | |||
Statutory income tax rate differential | ( | ( | |
Other | |||
Other Foreign Jurisdictions | ( | ( | |
Worldwide Changes in Unrecognized Tax Benefits | |||
Effective Tax Rate | $ | ||

*State taxes in California, Michigan, Florida, and Pennsylvania made up the majority (greater than 50 percent) of the
tax effect in this category.
100
The following table presents the reconciliation between tax expense at the U.S. federal statutory income tax rate and
the effective income tax rate for income before taxes, prior to the Company's adoption of ASU 2023-09:
December 31, 2024 | December 31, 2023 | |||
Statutory U.S. federal tax rate | ||||
State taxes, net of federal benefit | ||||
Foreign rate differential | ( | ( | ||
Change in unrecognized tax benefit | ||||
Valuation allowance | ( | ( | ||
Rate change | ( | ( | ||
Foreign tax credit | ( | ( | ||
U.S. tax on foreign earnings | ||||
Provision to Return | ( | |||
Research and development tax credit | ( | ( | ||
Stock-based compensation | ( | ( | ||
Foreign-derived intangible income deduction | ( | ( | ||
BEPS Pillar Two tax | ||||
Other, net | ( | |||
Effective income tax rate |
101
(in thousands) | December 31, 2025 | December 31, 2024 | |
Deferred income tax liabilities: | |||
Goodwill | $( | $( | |
Intangible assets | ( | ( | |
Property, plant and equipment | ( | ( | |
Deferred financing costs | ( | ||
Unremitted Foreign Earnings | ( | ||
Other | ( | ( | |
Deferred income tax liabilities | ( | ( | |
Deferred income tax assets: | |||
Inventory | |||
Debt issuance costs | |||
Product warranties | |||
Net operating loss and credit carry forwards | |||
Other assets | |||
Pensions and employee benefits | |||
Interest limitation | |||
Research and development costs | |||
Unrealized Foreign Exchange Gain/Loss | |||
Other | |||
Gross deferred income tax assets | |||
Less: valuation allowance | ( | ( | |
Deferred income tax assets | |||
Net deferred income tax liability | $( | $( |
The Company has recorded valuation allowances for certain tax attributes and other net deferred tax assets. At this
time, sufficient uncertainty exists regarding the future realization of these net deferred tax assets. A valuation allowance in
the amount of $13.8 million has been recorded against the deferred tax assets for the US foreign tax credit and the losses in
various countries where future earnings are not assured. If, in the future, the Company believes that it is more likely than
not that these deferred tax benefits will be realized, the valuation allowances will be reversed and recognized in income.
At December 31, 2025, the Company does not have any U.S. federal and state net operating loss carryforwards. The
Company’s U.S. federal and state credit carryforwards were approximately $4.1 million and $6.0 million, respectively. The
federal credit carryforwards will expire in 6 -10 years. The state credit carryforwards will expire in 1 -15 years.
As of December 31, 2025, the Company has foreign net operating loss carryforwards of $49.7 million, of which $40.7
million has a valuation allowance reserve. The remaining foreign net operating loss carryforward of $9.0 million is
expected to be fully utilized prior to expiration. The foreign net operating loss carryforwards will expire in 1 -12 years.
permanently reinvested at December 31, 2025. In addition to the one-time transition tax imposed on all accumulated
foreign undistributed earnings through December 31, 2017, undistributed earnings of foreign subsidiaries as of
December 31, 2025 may still be subject to certain taxes upon repatriation, primarily where foreign withholding taxes apply.
We assert indefinite reinvestment on investments in certain foreign subsidiaries and do not in other foreign subsidiaries.
The Company has recorded deferred income taxes for related outside basis differences, including applicable foreign
102
withholding taxes and other taxes that would be due upon remittance. The related tax expense (benefit) is recognized in the
period the Company no longer meets (or cannot support) the indefinite reinvestment assertion.
The Company has approximately $4.5 million of unrecognized tax benefits as of December 31, 2025, which, if
recognized, would impact the effective tax rate. The Company’s policy is to accrue interest and penalties related to
unrecognized tax benefits in income tax expense. Accrued interest and penalties related to the reserve for uncertain tax
positions were $0.9 million at December 31, 2025, $0.8 million at December 31, 2024, and $0.5 million at December 31,
2023. The Company files income tax returns in the U.S. federal jurisdiction and various state and foreign jurisdictions. Tax
years which remain subject to examination by tax authorities for the Company’s significant tax jurisdictions include 2020
and after for the United States, 2022 and after for Belgium, 2022 and after for the Czech Republic, and 2020 and after for
Luxembourg.
excluding interest and penalties:
Year Ended December 31, | |||||
(in thousands) | 2025 | 2024 | 2023 | ||
Beginning balance | $ | $ | $ | ||
Additions based on tax positions related to the current year | |||||
Subtractions based on lapse of statute | ( | ( | ( | ||
(Subtractions)/additions based on tax positions related to the prior year | ( | ||||
Ending balance | $ | $ | $ | ||
Tax Holidays
In Thailand, we have been granted a long-term tax holiday which is scheduled to expire in 2027. The tax benefit
related to the tax holiday is less due to the Qualified Domestic Minimum Top-up Tax enacted in Thailand in 2025. The
following table presents the effects of income tax expense exemptions available to the Company.
Year Ended December 31, | |||||
(in thousands, except per share amounts) | 2025 | 2024 | 2023 | ||
Tax benefit related to tax holidays | $ | $ | $ | ||
Impact of tax holiday on basic net income per share | $ | $ | $ | ||
Impact of tax holiday on diluted net income per share | $ | $ | $ | ||
Note 16 - Product Warranties
The Company offers product warranties to its commercial and Commercial In-Home customers depending upon the
specific product type and the product use. Standard product warranties vary from one to seven years . The standard
warranty program includes replacement of defective components. Additionally, the standard warranty covers labor costs for
repairs solely related to Commercial In-Home equipment.
The Company records an estimate for future warranty related costs based on the projected incident rates of occurrence
and projected cost per incident. The carrying amount of the Company’s warranty liability is adjusted as necessary based on
an analysis of these and other factors.
103
Year Ended December 31, | |||
(in thousands) | 2025 | 2024 | |
Balance at beginning of period | $ | $ | |
Currency translation adjustment | ( | ||
Accruals charged to earnings | |||
Payments made during the period | ( | ( | |
Balance at end of period | $ | $ | |
Product warranty of $30.4 million and $26.6 million is recorded in Other current liabilities in the Consolidated Balance
Sheets as of December 31, 2025 and 2024, respectively. Product warranty of $38.7 million and $25.2 million is recorded in
Other long-term liabilities in the Consolidated Balance Sheets as of December 31, 2025 and 2024, respectively.
Note 17 - Pensions and Other Employee Benefits
Defined benefit pension plan
We maintained a defined benefit pension plan covering certain U.S. employees whose hire date was on or before
January 1, 2009, for salaried employees, or January 1, 2006 for hourly employees. On February 1, 2022, the Board of
Directors approved an amendment to freeze benefits and terminate the salaried and hourly pension plan. The plan
discontinued accruing benefits on March 31, 2022 and termination was effective April 30, 2022.
During 2022, the Company offered participants the option to be fully paid out in a lump sum or to be paid over time
through an annuity. Lump sum settlement elections were fully satisfied in 2022, with payments of $26.3 million made from
plan assets. In 2023, the Company finalized an insurance placement for the annuity purchasers in the amount of $36.3
million. Additionally, the Company contributed $2.0 million to the pension plan and reduced the liability thereunder to
For the period ended December 31, 2023, the Company recorded a charge of $6.9 million related to the termination of
the pension plan in the Consolidated Statements of Comprehensive Income. The costs were primarily comprised of the pre-
tax losses from the pension plan that were recorded and held in Accumulated other comprehensive income/(loss).
(in thousands) | Year Ended December 31, 2023 |
Service cost benefits earned during the period | $ |
Interest cost on projected benefit obligation | |
Expected return on plan assets | ( |
Amortization of net actuarial losses | |
Settlement loss | |
Net pension loss | $ |
The following table presents the assumptions used in determining net pension benefit cost.
Year Ended December 31, 2023 | |
Discount rate | |
Expected long-term rate of return on assets |
The Company used a 2.0 % long-term rate of return on assets assumption in determining the net pension benefit cost
for 2023.
104
funded status.
(in thousands) | 2023 |
Change in benefit obligation: | |
Benefit obligation at beginning of period | $ |
Service cost | |
Interest cost | |
Actuarial loss | |
Benefits paid | ( |
Plan termination settlements | ( |
Benefit obligation at end of period | $ |
Change in plan assets: | |
Fair value of plan assets at beginning of period | $ |
Actual return on plan assets | ( |
Employer contributions | |
Benefits paid | ( |
Plan termination settlements | ( |
Fair value of plan assets at end of period | $ |
Funded status (liability) | $ |
Post-retirement benefits
In the U.S., the Company also provides post-retirement benefit plans including health care, salary continuation and
death benefits for eligible retirees and their dependents. Alliance Laundry’s healthcare benefits cover retired employees
upon early retirement up to age 65 . The retiree medical plan’s eligibility changed effective December 31, 2015. Non-union
employees must have attained age 55 and 15 years of service by December 31, 2015 in order to be eligible for future retiree
medical benefits. Prior to the change, employees with more than 10 years of service were eligible for these benefits if they
reach age 62 while working for the Company. Retiree health plans are paid for in part by retiree contributions and are
adjusted annually. Benefits are provided through various insurance companies whose charges are based either on the
benefits paid during the year or annual premiums.
Year Ended December 31, | |||||
(in thousands) | 2025 | 2024 | 2023 | ||
Service cost benefits earned during the period | $ | $ | $ | ||
Interest cost on projected benefit obligation | |||||
Amortization of prior service (credit) | ( | ( | ( | ||
Amortization of net actuarial (gain) | ( | ( | ( | ||
Net other post-retirement benefit cost | $ | $ | $ | ||
The assumed discount rates used in determining the net other post-retirement benefit cost were 5.60 %, 5.00 %, and
105
post-retirement benefit plans.
2025 | 2024 | ||
Change in benefit obligation: | |||
Benefit obligation at beginning of period | $ | $ | |
Service cost | |||
Interest cost | |||
Actuarial gain | ( | ||
Benefits paid | ( | ( | |
Benefit obligation at end of period | $ | $ | |
Change in plan assets: | |||
Contributions | $ | $ | |
Benefits paid | ( | ( | |
Fair value of plan assets at end of year | $ | $ | |
Funded status (liability) | $( | $( | |
Amounts recognized in Consolidated Balance Sheets: | |||
Other current liabilities | $( | $( | |
Other long-term liabilities | ( | ( | |
$( | $( |
The assumed discount rates used to determine the net other post-retirement benefit obligation were 5.5 % at
December 31, 2025 and 5.6 % at December 31, 2024. The Company uses a December 31 measurement date for these plans.
Annual rates of increase in the per capita cost of covered healthcare benefits of 7.7 % and 6.9 % were assumed in 2025
and 2024, respectively, to determine the benefit obligation at the end of the year. The rates in 2025 and 2024 are assumed
to decrease gradually to 4.0 % until 2050 and remain at that level thereafter.
Year | Other Benefits |
2026 | $ |
2027 | |
2028 | |
2029 | |
2030 | |
2031 and thereafter |
106
income/(loss).
Other Benefits | |
Balances at December 31, 2023 | $ |
Net gain | |
Amortization of net gain | ( |
Other recognition of prior service (credit) | ( |
Deferred tax | ( |
Balances at December 31, 2024 | |
Net (loss) | ( |
Amortization of net gain | ( |
Other recognition of prior service (credit) | ( |
Deferred tax | |
Balances at December 31, 2025 | $ |
Eligible U.S. employees are able to participate in the Alliance Laundry Systems Capital Appreciation Plan
(“ALCAP”). ALCAP is a qualified plan under Sections 401(a) and 401(k) of the Internal Revenue Code. In addition, the
Company makes a discretionary annual contribution to the ALCAP equal to one and a half percent of salaries and wages,
subject to statutory limits, for eligible union personnel. Under the terms of ALCAP, covered employees are allowed to
contribute up to 50 percent of their pay on a pre-tax basis up to the limit established by the Internal Revenue Service. The
Company matches 100 percent of the first six percent of the employee’s contributions for all non-union personnel. The
Company matches 50 percent of the first six percent of the employee’s contributions for all union personnel. Total expense
for ALCAP, including discretionary contributions, was $8.6 million, $7.1 million and $6.6 million for the year ended
December 31, 2025, 2024 and 2023, respectively.
Note 18 - Debt
6 - Asset Backed Facilities and Note 7 - Securitization Activities.
(in thousands) | December 31, 2025 | December 31, 2024 | |
Term Loan due August 2031 ( respectively) | $ | $ | |
Finance lease obligations | |||
Gross long-term debt | |||
Less: current portion of Term Loan | ( | ||
Less: current portion of finance lease obligations | ( | ( | |
Less: unamortized debt issuance costs on Term Loan | ( | ( | |
Less: unamortized original issue discount on Term Loan | ( | ( | |
Long-term debt, net | $ | $ |
The Company’s effective interest rate on our Term Loan was 6.01 % as of December 31, 2025, after taking into
account the impact of issuance costs.
Credit Facility
On August 19, 2024, the Company entered into a credit agreement, by and among Alliance Laundry Holdings LLC
("Alliance Holdings"), Alliance Laundry as the Borrower (“Borrower”), the lenders party thereto and Citibank, as
Administrative Agent (the “Credit Agreement”). The Credit Agreement provides for (i) an initial Term Loan facility (the
107
“Term Loan”) in the aggregate principal amount of $2,075.0 million and (ii) initial revolving credit facilities (the “RCF”
and, together with the Term Loan, the “Credit Facility”) of $250.0 million principal amount of revolving commitments,
with $225.0 million issuable in U.S. Dollars or Euros and $25.0 million issuable in Thai Baht, with a $102.2 million sub-
limit for issuance of letters of credit and a $25.0 million sub-limit for swingline loans. At closing, the Borrower borrowed
$2,075.0 million of aggregate principal of the Term Loan and did not borrow under the RCF. Upon closing, the Borrower
used the net proceeds of the Term Loan to repay outstanding borrowings under its existing credit facility at the time and to
fund a stockholder dividend distribution. The Term Loan was issued with an original issue discount of 50 basis points.
Interest is payable no less frequently than quarterly at the rate of SOFR plus 3.5 % (or the applicable base rate plus 2.5 %),
with a 0 % SOFR floor. Interest under the RCF accrues at the rate of SOFR plus 3.25 % (or the applicable base rate plus
On February 20, 2025, we finalized an amendment to our Credit Agreement, which reduced the applicable margin on
the Term Loan and RCF. The result was an interest rate on our Term Loan of SOFR plus 2.75 % and an interest rate on our
RCF of SOFR plus 2.50 %. Additionally, we incorporated opportunities for further margin reductions contingent upon
achieving improvements in our leverage ratio. The company incurred $1.0 million of fees in connection with the
amendment. These fees were expensed and included in Other expenses, net in the Consolidated Statement of
Comprehensive Income.
On August 21, 2025, we finalized an amendment to our Credit Agreement, which reduced the applicable margin on the
Term Loan and RCF. The result is an interest rate on our Term Loan of SOFR plus a margin of 2.25 % and an interest rate
on our RCF of SOFR plus a margin of 2.25 %. Additionally, we incorporated opportunities for further margin reductions
contingent upon achieving improvements in our leverage ratio and rating agency upgrades. The company incurred $1.3
million of fees in connection with the amendment. These fees were expensed and included in Other expenses, net in the
Consolidated Statement of Comprehensive Income. As of December 31, 2025, the interest rate under the RCF was 6.12 %.
Additionally, a commitment fee based upon the Company’s leverage ratio is charged on the unused portion of the
commitments under the RCF. As of December 31, 2025, the commitment fee was 0.25 %.
During 2025, the Company made total voluntary prepayments on the Term Loan of $710.0 million, consisting of a
$525.0 million prepayment on October 17, 2025, funded with net proceeds from the Company's initial public offering and
cash on hand, and $185.0 million of other voluntary prepayments made during the year. The repayments were first applied
to and eliminated the future required quarterly installment principal repayments.
The Credit Agreement requires certain mandatory prepayments, including from asset sales and, beginning with the
fiscal year ending December 31, 2025, annual prepayments of the Term Loan with 50 % of the Company’s Excess Cash
Flow, which steps down to 25 % if the Company’s net leverage ratio is below 4.75 :1 and to 0 % if the net leverage ratio is
below 4.5 :1. Excess Cash Flow is defined in the Credit Agreement as consolidated adjusted EBITDA (earnings before
interest, taxes, depreciation and amortization), adjusted for the net change in working capital for the fiscal year, less other
specified deductions such as debt and debt service payments, and interest and taxes paid in cash. Working capital is defined
as current assets excluding cash and cash equivalents less current liabilities excluding current portion of long term debt and
various other adjustments. The Company has not been subject to any mandatory prepayments. Outstanding balances are
fully prepayable on a voluntary basis, in whole or in part, without premium or penalty. The remaining balance of the Term
Loan is due at maturity on August 19, 2031. The RCF matures on August 19, 2029, and it does not require any installment
principal repayments or mandatory commitment reductions. Outstanding balances under the RCF are fully prepayable on a
voluntary basis, in whole or in part, and commitments may be terminated, in whole or in part, in each case without
premium or penalty. Obligations under the Credit Agreement are secured by substantially all of the Company.
The Credit Agreement contains covenants that are customary for similar credit arrangements, including, among other
things, covenants relating to: (i) financial reporting and notification, (ii) payment of obligations, (iii) compliance with
applicable laws, (iv) notification of certain events, and (v) certain covenants limiting the ability of the Borrower and its
subsidiaries to, among other things, sell or transfer assets, consummate fundamental changes, incur or guarantee
indebtedness or liens, make investments, or enter into transactions with affiliates. The Company is in compliance with all
covenants as of December 31, 2025.
The RCF is available, subject to certain conditions, for general corporate purposes in the ordinary course of business
and for other transactions permitted under the Credit Agreement. A portion of the RCF not in excess of $102.0 million is
available for the issuance of letters of credit. There were no
December 31, 2024 and December 31, 2025.
108
Other Debt
As discussed in greater detail in Note 7 - Securitization Activities, the Company had total debt outstanding of $618.6
million and $553.8 million related to its securitization activities as of December 31, 2025 and December 31, 2024,
respectively.
Prior Refinanced and Terminated Debt
On October 9, 2020, Alliance Holdings entered into a credit agreement, by and among Alliance Holdings, Alliance
Laundry as the Borrower, the lenders party thereto and UBS AG, as Administrative Agent (the “Prior Credit Agreement”).
The Prior Credit Agreement provided for (i) an initial term loan facility in the aggregate principal amount of $1,325.0
million and (ii) an initial revolving facility of $125.0 million principal amount of revolving commitments. This term loan,
set to mature in 2027, was paid off early in 2024 with proceeds from the term loan associated with the Credit Agreement
entered into on August 19, 2024.
On December 2018, an indirect wholly-owned subsidiary of the Company, Alliance Laundry (Thailand) Company
Limited, entered into a 7.5 million Thai Baht revolving credit facility (“Thailand Revolving Credit Facility”). The Thailand
Revolving Credit Facility was terminated on August 8, 2024.
In July 2020, a subsidiary of the Company, Alliance do Brasil Maquinas DE Lavanderia Ltda., entered into an import
financing agreement with the Banco Santander (Brasil) S.A. (“Brazil Import Loan”). The loan was guaranteed by the
Company through a letter of credit in the amount of $2.0 million. The loan allowed for a $2.0 million maximum of
issuances and a maturity of two years after each draw. The loan was used to fund laundry equipment purchases. Effective
December 12, 2024, the Brazil Import letter of credit was terminated.
Debt Issuance Costs and Original Issue Discount
In February 2025 and August 2025, the Company incurred $1.0 million and $1.3 million, respectively, of fees in
connection amendments to the Credit Agreement. These fees were expensed and included in Other Expenses, net in the
Consolidated Statements of Comprehensive Income. Additionally, the Company wrote off a portion of the unamortized
debt issuance costs and original issuance discounts related to the Prior Credit Agreement, resulting in expense of $1.3
million recorded in Other expenses, net in the Consolidated Statements of Comprehensive Income for the year ended
December 31, 2025.
In August 2024, the Company incurred $32.8 million of fees in connection with the execution of the Credit Agreement
of which $30.4 million was expensed immediately and the remaining $2.4 million was capitalized. These fees were
expensed and included in Other Expenses, net and Other expenses, net - related parties in the Consolidated Statements of
Comprehensive Income. The Company also capitalized $10.4 million for original issuance discount in 2024 related to the
New Credit Agreement, which is included in Long-term debt, net in the Consolidated Balance Sheets. Additionally, the
Company wrote off a portion of the unamortized debt issuance costs and original issuance discounts related to the Prior
Credit Agreement, resulting in additional expense of $2.8 million. This amount was also recorded in Other expenses, net in
the Consolidated Statements of Comprehensive Income for the current period.
Year Ended December 31, | |||||
(dollars in thousands) | 2025 | 2024 | 2023 | ||
Amortization expense - debt issuance costs | $ | $ | $ | ||
Amortization expense - original issue discount | $ | $ | $ | ||
109
Debt Maturities and Liquidity Considerations
Year | Amount Due |
2026 | $ |
2027 | |
2028 | |
2029 | |
2030 | |
Thereafter | |
Less: Current portion | ( |
Less: unamortized debt issuance costs on Term Loan | ( |
Less: unamortized original issue discount on Term Loan | ( |
Long-term debt | $ |
Note 19 - Stockholders' Equity
Dividends
On August 14, 2024, the Company’s board of directors approved a special dividend totaling $900.0 million to common
stockholders and warrant holders of record as of August 13, 2024 and subsequently paid in 2024. There were no dividends
declared or paid in the year-ended December 31, 2025.
Preferred Stock
We are authorized, subject to limitations prescribed by Delaware law, to issue preferred stock in one or more series; to
establish the number of shares included within each series; to fix the rights, preferences and privileges of the shares of each
wholly unissued series and any related qualifications, limitations or restrictions; and to increase or decrease the number of
shares of any series (but not below the number of shares of a series then outstanding) without any further vote or action by
our stockholders. As of December 31, 2025 and 2024, there were 100,000,000 0.01
authorized for issuance, with no
Common Stock
Our Amended and Restated Certificate of Incorporation authorizes us to issue 2,000,000,000 shares of common stock.
110
Accumulated Other Comprehensive Income/(Loss)
Pension Liability, and Other Post- retirement Benefits, Net | Foreign Currency Translation | Total | |||
Balance as of December 31, 2022 | $( | $ | $ | ||
Other comprehensive income/(loss) before reclassifications | |||||
Amounts reclassified from accumulated other comprehensive income/(loss) | |||||
Net other comprehensive income | |||||
Balance as of December 31, 2023 | |||||
Other comprehensive income/(loss) before reclassifications | ( | ( | |||
Amounts reclassified from accumulated other comprehensive income/(loss) | ( | ( | |||
Net other comprehensive income/(loss) | ( | ( | |||
Balance as of December 31, 2024 | ( | ( | |||
Other comprehensive income/(loss) before reclassifications | ( | ||||
Amounts reclassified from accumulated other comprehensive income/(loss) | ( | ( | |||
Net other comprehensive (loss)/income | ( | ||||
Balance as of December 31, 2025 | $ | $ | $ |
on the Consolidated Statements of Comprehensive Income.
Gain/(loss) Reclassified | |||||
Year Ended December 31, | |||||
(in thousands) | 2025 | 2024 | 2023 | ||
Pension and post-retirement benefits, pre-tax: | |||||
Amortization of prior service credit(1) | $( | $( | $( | ||
Amortization of actuarial gain(1) | ( | ||||
Settlement loss(2) | ( | ||||
Reclassification before tax | ( | ( | |||
Tax provision/(benefit) | ( | ||||
Total reclassification from accumulated other comprehensive (loss)/ income | $( | $ | $( | ||
________________
(1)Amortization of prior service credit and actuarial gain are included in the Company’s net pension benefit cost, which is allocated between Cost of
sales and Selling, general and administrative expenses within the Company’s Consolidated Statements of Comprehensive Income.
(2)Settlement loss is included in Other expenses, net within the Company’s Consolidated Statements of Comprehensive Income. Refer to Note 17 -
Pensions and Other Employee Benefits, for more information.
Note 20 - Stock Based Compensation
2015 Stock Option Plan
In 2015, ALH established a stock option plan (the “2015 Stock Option Plan”) to award options to purchase shares of
the Company's common stock to directors, officers, key employees and service providers of the Company. In connection
with the IPO, the Company’s board of directors and stockholders terminated the 2015 Stock Option Plan and approved the
2025 Omnibus Incentive Compensation Plan. No further awards will be granted under the 2015 Stock Option Plan, but
111
existing awards will continue to vest and be exercisable in accordance with the plan terms. Under the plan, options have a
term of 10 years and an exercise price equal to 100 % of the fair market value of the Company’s common stock at the grant
date. Granted time-based options vest in five equal annual installments of the stated vesting commencement date with the
potential for accelerated vesting upon a change in control of ALH. In connection with the IPO on October 9, 2025, all then-
outstanding performance-based options vested. When options are exercised, the Company issues new shares of common
stock.
The Company accounts for the 2015 Stock Option Plan awards under the equity classification model as the Company
expects to share settle the awards. ASC 718, Compensation - Stock Compensation, requires that a company measure the
fair market value of the awards as of the grant date. The Company has elected to recognize the compensation cost on a
straight-line basis over the requisite service period of the award.
Share Options | Weighted Average Exercise Price (Per Share) | Weighted Average Remaining Contractual Term | Aggregate Intrinsic Value (in millions) | ||||
Options outstanding as of December 31, 2024 | $ | ||||||
Granted | |||||||
Exercised | ( | ||||||
Forfeited | ( | ||||||
Options outstanding as of December 31, 2025 | $ | $ | |||||
Options exercisable as of December 31, 2025 | $ | $ |
For the year ended December 31, 2025, the Company issued 572,143 time-based options and 572,143 performance-
based options.
For performance-based options, the Company uses the Monte Carlo valuation simulation to measure the grant date fair
value. For service-based options, the Company uses the Black-Scholes option price model to measure the grant date fair
value. Assumptions used to determine fair value of each option were based upon historical and standard industry valuation
practices and methodology. A summary of the weighted average assumptions are as follows.
2025 | 2024 | 2023 | |||
Expected volatility | |||||
Expected dividend yield | |||||
Expected forfeiture rate | |||||
Expected term of option | |||||
Risk-free rate of return |
The weighted-average grant date fair value of time-based options issued under the 2015 Stock Option Plan were $5.04 ,
$4.63 , and $5.88 per share option for the respective 2025, 2024, and 2023 periods. The weighted-average grant date fair
value of performance-based options issued under the 2015 Stock Option plan was $1.20 , $2.00 , and $2.40 per share option
for the respective 2025, 2024, and 2023 periods.
At December 31, 2025, the Company had approximately $3.2 million of total unrecognized compensation cost related
to unvested time-based stock options granted to employees, to be recognized over a weighted average period of 3.4 years.
At December 31, 2024, the Company had approximately $4.4 million of total unrecognized compensation cost related to
unvested time-based stock options granted, to be recognized over a weighted average period of 2.3 years. Total expense
recognized for performance-based options was $16.0 million for the year-ended December 31, 2025, as the awards fully
vested upon the Company's IPO. As of December 31, 2025, the Company had no unrecognized compensation cost related
to unvested performance-based stock options, compared to approximately $10.2 million as of December 31, 2024. No
expense was recognized for these awards in 2024 or 2023, as achievement of the performance conditions were not
considered probable.
112
Year Ended December 31, 2025 | Year Ended December 31, 2024 | Year Ended December 31, 2023 | |||
Intrinsic value of options exercised | $ | $ | $ | ||
Compensation expense recognized | $ | $ | $ | ||
Income tax benefit | $ | $ | $ |
Compensation expense is included in Selling, general and administrative expenses within the Consolidated Statements
of Comprehensive Income.
2025 Omnibus Incentive Compensation Plan
In 2025, ALH adopted the 2025 Omnibus Incentive Compensation Plan (the “2025 Compensation Plan”). The 2025
Compensation Plan allows the Company to grant equity-based incentive awards to eligible directors, officers, employees,
and consultants. The plan replaced the Company’s 2015 Stock Option Plan and permits the issuance of stock options, stock
appreciation rights, restricted shares, restricted stock units ("RSUs") and cash incentive awards. Stock options and stock
appreciation rights granted under the plan generally must have an exercise price of at least 100 % of the fair market value of
our Common Stock on the grant date. The Company has initially reserved 9,864,490 shares of Common Stock for issuance
under the 2025 Compensation Plan, subject to adjustment for certain corporate transactions. The number of shares available
for issuance under the 2025 Compensation Plan will be increased automatically on January 1 of each calendar year prior to
the plan’s expiration, by a number of shares equal to 2.5 % of the shares outstanding on the last day of the immediately
preceding calendar year, subject to the Compensation Committee's discretion to reduce or eliminate the increase for any
given year.
During the year-ended December 31, 2025 the Company granted RSUs to certain employees and non-employee
directors. The RSUs granted to employees generally vest ratably over four years , while the RSUs granted to non-employee
directors fully vest on the first anniversary of the grant date. The fair value of RSUs is determined based on the closing
market value of our common stock on the grant date. The Company has elected to recognize the compensation cost on a
straight-line basis over the requisite service period of the award.
Restricted Units | Weighted Average Price | ||
Non-vested as of December 31, 2024 | $ | ||
Granted | |||
Vested | |||
Forfeited | ( | ||
Non-vested as of December 31, 2025 | $ |
For the year-ended December 31, 2025, the Company recognized $0.8 million in compensation expense for restricted
stock units. As of December 31, 2025, the Company had approximately $9.1 million of total unrecognized compensation
cost related to non-vested restricted stock units which is expected to be recognized over a weighted-average period of 3.5
years.
2025 Employee Stock Purchase Plan
On September 25, 2025, ALH adopted the 2025 Employee Stock Purchase Plan (the “ESPP”). The ESPP allows the
Company to make one or more offerings to its employees to purchase shares under the ESPP. The first offering will begin
and end on dates to be determined by the plan administrator. The ESPP allows participants to purchase Common Stock
through contributions of their eligible compensation, subject to limitations established by the plan administrator. The
purchase price of the Common Stock will be 85 % of the lesser of the fair market value of our Common Stock on the
applicable offering start date or the applicable purchase date (provided that a higher price may be determined by the plan
113
administrator). The Company has initially reserved 2,959,347 shares of Common Stock for issuance under the ESPP. The
number of shares available for issuance under the ESPP will be increased automatically on January 1 of each calendar year
for ten years , beginning on the first January 1 following the effective date of the ESPP, by a number of shares of our
Common Stock equal to the lesser of (i) 0.5 % of the shares outstanding on the last day of the immediately preceding
calendar year; and (ii) a number of shares as may be determined by the Administrator; provided that the total number of
shares issued under the plan shall not exceed 20,715,430 . As of December 31, 2025, the ESPP has not been activated and
there were no offering periods during 2025.
Note 21 - Earnings Per Share
Basic net income per share of common stock is computed by dividing net income attributable to common stockholders
by the weighted-average number of shares of common stock outstanding during the period. Diluted net income per share of
common stock is computed by including the basic weighted-average shares of common stock outstanding adjusted for the
effects of all dilutive potential shares of common stock, which include, if dilutive, outstanding stock awards. The
computation of diluted earnings per share excludes the effect of the potential exercise of stock-based awards, including
Stock Options, when the effect of the potential exercise would be anti-dilutive. The dilutive impact of the stock options is
determined by applying the treasury stock method.
The Company issued penny warrants, exercisable after the original issuance date, granting the holders the right to
purchase common shares of the Company with par value of $0.01 per share at an issuance price of $0.01 per share. On June
30, 2025, all 45,315,182 warrants were exercised and therefore no warrants remained outstanding as of December 31,
2025. The Company had 45,315,182
$0.01
per share of common stock, and thus are included in the computation of basic and diluted net income per share of common
stock for the years ended December 31, 2025, 2024, and 2023. The holder of a warrant was entitled to receive all dividends
or other distributions payable on the common shares unless a corresponding adjustment was made to the number of
common shares issuable upon exercise of the warrant and the exercise price of the warrants.
(in thousands, except per share amounts) | For the Year Ended December 31, | ||||
2025 | 2024 | 2023 | |||
Numerator | |||||
Income available to common stockholders (basic and diluted) | $ | $ | $ | ||
Denominator | |||||
Weighted-average number of common shares outstanding | |||||
Weighted-average number of warrants outstanding | |||||
Basic — weighted average number of shares outstanding | |||||
Effect of dilutive securities - time-vested options | |||||
Effect of dilutive securities - performance-based options | |||||
Effect of dilutive securities - restricted stock units | |||||
Diluted — weighted average number of shares outstanding | |||||
Earnings per share | |||||
Basic | $ | $ | $ | ||
Diluted | $ | $ | $ | ||
114
excluded from the calculation of diluted net income per share of common stock because including them would have had an
anti-dilutive effect:
For the Year Ended December 31, | |||||
2025 | 2024 | 2023 | |||
Time vesting options | |||||
Performance vesting options | |||||
Note 22 - Segment Information
The Company’s Chief Operating Decision Maker (CODM) is our Chief Executive Officer. The Company operates
through two
Canada) and International (all other global markets). This structure reflects how the CODM evaluates performance and
allocates resources. Across both reportable segments, we manufacture and sell commercial laundry equipment suitable for
diverse applications, ranging from small chassis products installed in laundromats, multi-housing facilities and residential
settings, to large industrial units designed for institutional laundry applications.
The CODM uses Adjusted EBITDA as the primary measure of segment profit and loss to evaluate the Company’s
financial performance against expected results and to allocate resources, including capital investment and potential
acquisitions. Adjusted EBITDA is a non-GAAP financial measure that is defined as net income excluding interest income/
expense, income taxes, depreciation and amortization. Adjusted EBITDA is also adjusted for the discrete items that
management excluded in analyzing the segments’ operating performance, such as refinancing and debt related costs, share-
based compensation, strategic transaction costs, foreign exchange on intercompany loans and other non-recurring items
which management believes are not indicative of the Company’s ongoing operating performance. Management believes
Adjusted EBITDA is the best measure to help users of its financial statements evaluate our operating performance and
facilitates more meaningful comparisons with industry peers. Adjusted EBITDA is not intended to serve as an alternative to
U.S. GAAP measures of performance and may not be comparable to similarly-titled measures presented by other
companies.
Sales between reportable segments are not provided to the CODM, and as such, inter-segment sales are not disclosed.
Assets are physically maintained primarily in the United States, Czech Republic, and Thailand. Total assets by
segment are not presented in the table below as the CODM is not provided total assets by reportable segment as the CODM
does not evaluate, manage, or measure performance of segments using total assets.
115
consolidated Income before taxes.
Year Ended December 31, 2025 | Year Ended December 31, 2024 | Year Ended December 31, 2023 | |||||||||||||||
(in thousands) | North America | International | Total | North America | International | Total | North America | International | Total | ||||||||
Net revenues | $ | $ | $ | $ | $ | $ | $ | $ | $ | ||||||||
Cost of sales(1) | |||||||||||||||||
Other segment items(2) | |||||||||||||||||
Adjusted EBITDA | $ | $ | $ | $ | $ | $ | $ | $ | $ | ||||||||
Reconciling items: | |||||||||||||||||
Interest expense, net | ( | ( | ( | ||||||||||||||
Depreciation and amortization | ( | ( | ( | ||||||||||||||
Refinancing and debt related costs | ( | ( | |||||||||||||||
Foreign exchange (loss)/gain on intercompany loans | ( | ( | |||||||||||||||
Share-based compensation | ( | ( | ( | ||||||||||||||
Strategic transaction costs | ( | ( | ( | ||||||||||||||
Pension termination costs | ( | ||||||||||||||||
Corporate and other | ( | ( | ( | ||||||||||||||
Income before taxes | $ | $ | $ | ||||||||||||||
________________
(1)Consists of Cost of sales, Cost of sales - related parties and Equipment financing expenses
(2)Other segment items for each reportable segment includes:
North America - engineering, sales and marketing, information technology, and certain other overhead expenses.
International - engineering, sales and marketing, information technology, and certain other overhead expenses.
Geographic Information
determined based on the location of where the sale originated.
For the Year Ended December 31, | |||||
(in thousands) | 2025 | 2024 | 2023 | ||
Net revenues: | |||||
United States | $ | $ | $ | ||
Czech Republic | |||||
Thailand | |||||
All other countries | |||||
Net revenues | $ | $ | $ | ||
Long-lived assets, which consist of property, plant and equipment and right-of-use assets, are presented in the table
below as of December 31, 2025 and 2024. These assets are disclosed based on their physical location, with the table
summarizing all countries that represent at least 10% of our consolidated long-lived assets:
For the Year Ended December 31, | |||
(in thousands) | 2025 | 2024 | |
Long-lived assets: | |||
United States | $ | $ | |
Czech Republic | |||
Thailand | |||
All other countries | |||
Total long-lived assets | $ | $ | |
116
Note 23 - Supplier Financing
The Company entered into a supplier financing arrangement with a third-party financial institution which allows
participating suppliers the ability to request early payment for eligible receivables due from the Company at their sole
discretion. The Company’s obligations to its suppliers, including amounts due and scheduled payment terms, are not
impacted by a suppliers’ decision to sell amounts under the arrangement. Payment terms with our suppliers, which we
deem to be commercially reasonable, range from 0 to 120 days. Outstanding payment obligations subject to the Company’s
supplier finance program at December 31, 2025 and December 31, 2024 were $8.0 million and $12.0 million, respectively,
and are included in Accounts payable in the Consolidated Balance Sheets.
(in thousands) | Supplier Financing Obligations |
Obligations outstanding at December 31, 2023 | $ |
New obligations | |
Payments against supplier obligations | ( |
Obligations outstanding at December 31, 2024 | |
New obligations | |
Payments against supplier obligations | ( |
Obligations outstanding at December 31, 2025 | $ |
Note 24 - Commitments and Contingencies
Legal Matters
The Company is subject to various other claims and contingencies arising out of the normal course of business,
including those relating to governmental investigations and proceedings, commercial transactions, product liability,
employee related matters, antitrust, safety, health, taxes, environmental and other matters. Litigation is subject to many
uncertainties and the outcome of individual litigated matters is not predictable with assurance. It is possible that some
litigation matters for which reserves have not been established could be decided unfavorably to us, and that any such
unfavorable decisions could have a material adverse effect on our consolidated financial condition, results of operations
and cash flows.
Note 25 - Related Parties
The Company has entered into various transactions with related parties. During the year-ended December 31, 2024,
and in connection with the Company’s refinancing, an arrangement fee of $5.2 million was paid to BDT from the proceeds
of the Term Loan, which is included in Other expenses, net - related parties in the Consolidated Statements of
Comprehensive Income. See Note 18 - Debt for more information on the Company’s debt and financing arrangements. In
August 2024, the Company declared and issued a dividend to its ordinary common stockholders, which included a $841.7
million dividend to BDT Badger Holdings, LLC (“Badger”) and $58.3 million in dividends to management common
stockholders. Additionally, BDT served as one of the underwriters of the IPO for which it received underwriting discounts
and commissions of approximately $2.8 million. Also, the Company’s Board of Directors has members that are employees
of BDT, which the Company paid $0.3
Entities affiliated with BDT hold a controlling interest in a vendor that the Company purchases raw materials from.
The Company made purchases of $7.2 million and $6.2 million from this vendor during the years ended December 31,
2025 and 2024, respectively, included in inventory and cost of sales. As of December 31, 2025 and 2024, the Company had
amounts due to this vendor of $1.9 million and $1.3 million, respectively, included in Accounts payable - related parties in
the Consolidated Balance Sheets.
Note 26 - Subsequent Events
The Company evaluates events occurring subsequent to the date of the financial statements in determining the
accounting for and disclosure of transactions and events that affect the financial statements.
117
Alliance Laundry Holdings Inc.
Schedule II - Valuation and Qualifying Accounts
(in thousands)
Allowance for Credit Losses - Accounts receivable, net:
Balance at Beginning of Period | Charges to Expense | Deductions | Impact of Foreign Exchange Rates | Balance at End of Period | |||||
December 31, 2025 | $ | ( | $ | ||||||
December 31, 2024 | $ | $ | |||||||
December 31, 2023 | $ | ( | $ |
Tax valuation allowance reserves:
Balance at Beginning of Period | Charges (Credits) to Expense | Deductions | Balance at End of Period | ||||
December 31, 2025 | $ | ( | $ | ||||
December 31, 2024 | $ | ( | $ | ||||
December 31, 2023 | $ | $ |
118
Item 9. Changes in and Disagreements with Accountants On Accounting and Financial Disclosure
None.
Item 9A. Controls and Procedures
Disclosure Controls and Procedures
We maintain disclosure controls and procedures that are designed to ensure that information required to be disclosed in
the reports that we file or submit under the Securities Exchange Act of 1934, as amended, (the “Exchange Act”) is
recorded, processed, summarized and reported within the time periods specified in the SEC’s rules and forms and that such
information is accumulated and communicated to our management, including our Chief Executive Officer and Chief
Financial Officer, as appropriate, to allow timely decisions regarding required financial disclosure.
As of the end of the period covered by this Annual Report on Form 10-K, our management, under the supervision and
with the participation of our principal executive officer and principal financial officer, evaluated the effectiveness of our
disclosure controls and procedures pursuant to Exchange Act Rule 13a-15(e) and 15d-15(e). Based on such evaluation, our
Chief Executive Officer and Chief Financial Officer have concluded our disclosure controls and procedures were, in design
and operation, effective at a reasonable assurance level.
Remediation of Previously Reported Material Weakness
As previously disclosed we identified a material weakness related to the design and maintenance of controls to prevent
or detect material misstatements to our consolidated financial statements. Specifically, we did not design, implement and
maintain an adequate review and approval process with respect to manual or non-routine journal entries.
Remediation Measures
In response to the identified material weakness management designed and implemented the following remediation
measures during the fiscal year ended December 31, 2025:
•Established a SOX Steering Committee to oversee remediation efforts.
•Remediated and restricted system user access to certain key financial functions with a focus on appropriate
segregation of duties.
•Redesigned our review and approval process over financially significant transactions for manual journal entries to
require documented, multi-level review by appropriately qualified personnel.
•Deployed controls and reporting within our ERP system for enhanced logging and audit trail capabilities to
support ongoing monitoring.
Conclusion on Remediation
The remediation measures described above were fully implemented and have been operating for a sufficient period of
time to allow management to test and conclude on the effectiveness of the related controls. Based on management's
assessment, including testing of the design and operating effectiveness of the enhanced controls, we have concluded that
the previously reported material weakness has been remediated as of December 31, 2025.
Exemption from Management's Report on Internal Control Over Financial Reporting
This Annual Report on Form 10-K does not include a report of management's assessment regarding internal control
over financial reporting or an attestation report of the Company's independent registered public accounting firm due to a
transition period established by rules of the Securities and Exchange Commission for newly public companies.
Changes in Internal Control Over Financial Reporting
Other than the actions to remediate the material weakness in our internal control over financial reporting as described
above, there were no changes in our internal control over financial reporting that materially affected, or are reasonably
likely to materially affect, our internal control over financial reporting during the three months ended December 31, 2025.
119
Limitations on the Effectiveness of Controls
Our disclosure controls and procedures and internal control over financial reporting are designed to provide reasonable
assurance of achieving their objectives as specified above. Management does not expect that our disclosure controls and
procedures will prevent or detect all error and fraud. Any control system, no matter how well designed and operated, is
based on certain assumptions and can provide only reasonable, not absolute, assurance that its objectives will be met.
Further, no evaluation of controls can provide absolute assurance that misstatements due to error or fraud will not occur or
that all control issues and instances of fraud, if any, within the Company have been detected.
Item 9B. Other Information
During our fiscal quarter ended December 31, 2025, none of our directors or officers (as defined in Rule 16a-1(f)
under the Exchange Act) entered terminated
instructions or written plans for the purchase or sale of our securities that are intended to satisfy the conditions specified in
Rule 10b5-1(c) under the Exchange Act for an affirmative defense against liability for trading in securities on the basis of
material nonpublic information or (ii) non-Rule 10b5-1 trading arrangements (as defined in Item 408(c) of Regulation S-
K).
Item 9C. Disclosure Regarding Foreign Jurisdiction that Prevent Inspections
None.
120
Part III
Item 10. Directors, Executive Officers and Corporate Governance
Information required by Item 10 of Part III will be included in our Proxy Statement relating to our 2026 Annual
Meeting of Stockholders and is incorporated herein by reference.
Item 11. Executive Compensation
Information required by Item 11 of Part III will be included in our Proxy Statement relating to our 2026 Annual
Meeting of Stockholders and is incorporated herein by reference.
Item 12. Security Ownership of Certain Beneficial Owners and Management and Related Stockholder Matters
Information required by Item 12 of Part III will be included in our Proxy Statement relating to our 2026 Annual
Meeting of Stockholders and is incorporated herein by reference.
Item 13. Certain Relationships and Related Transactions, and Director Independence
Information required by Item 13 of Part III will be included in our Proxy Statement relating to our 2026 Annual
Meeting of Stockholders and is incorporated herein by reference.
Item 14. Principal Accountant Fees and Services
Information required by Item 14 of Part III will be included in our Proxy Statement relating to our 2026 Annual
Meeting of Stockholders and is incorporated herein by reference.
121
Part IV
Item 15. Exhibits and Financial Statement Schedules.
(a)Exhibits: The list of exhibits set forth under “Exhibit Index” at the end of this Annual Report is incorporated
herein by reference.
(b)Financial Statement Schedules: See “Index to Consolidated Financial Statements” included on page 65 for a list
of the financial statement schedules included in this Annual Report. All schedules not identified above have been
omitted because they are not required, are inapplicable or the information is included in the consolidated
financial statements or the related notes contained in this Annual Report.
Exhibit Index
Exhibit Number | Description | |
3.1 | ||
3.2 | ||
4.1* | ||
10.1 | ||
10.2 | ||
10.3 | ||
10.4 | ||
10.5 | ||
10.6 | ||
10.7 |
122
10.8 | ||
10.9 | ||
10.10 | ||
10.11 | ||
10.12 | ||
10.13 | ||
10.14 | ||
10.15* | ||
10.16 | ||
10.17 | ||
10.18 | ||
10.19† | ||
10.20† | ||
10.21† |
123
10.22† | ||
10.23† | ||
10.24† | ||
10.25† | ||
10.26† | ||
10.27† | ||
10.28† | ||
10.29† | ||
10.30† | ||
10.31† | ||
10.32† | ||
10.33† | ||
10.34† | ||
10.35† | ||
10.36† | ||
19.1* | ||
21.1* | ||
23.1* | ||
31.1* | ||
31.2* | ||
32.1* | ||
32.2* | ||
97.1* | ||
101.INS | Inline XBRL Instance Document - the instance document does not appear in the Interactive Data File because XBRL tags are embedded within the Inline XBRL document. |
124
101.SCH | Inline XBRL Taxonomy Extension Schema With Embedded Linkbase Documents | |
104 | Cover Page Interactive Data File (embedded within the Inline XBRL document) |
______________________
*Filed herewith.
†Indicates management contract or compensatory plan.
Item 16. Form 10-K Summary
None.
125
Signatures
Pursuant to the requirements of the Securities Act of 1933, the registrant has duly caused this Annual Report to be
signed on its behalf by the undersigned, thereunto duly authorized, in Ripon, Wisconsin on March 13, 2026.
Alliance Laundry Holdings Inc. | ||
By: | /s/ Michael D. Schoeb | |
Name: | Michael D. Schoeb | |
Title: | Chief Executive Officer and Director | |
Signatures and Powers of Attorney
KNOW ALL PERSONS BY THESE PRESENTS, that each person whose signature appears below constitutes and
appoints each of Michael D. Schoeb and Samantha L. Hannan, and each of them, as his or her true and lawful attorney-in-
fact and agent with full power of substitution and resubstitution, for such individual in any and all capacities, to sign any
and all amendments to this Annual Report on Form 10-K, and to file the same, with all exhibits thereto and other
documents in connection therewith, with the Securities and Exchange Commission, granting unto said attorneys-in-fact and
agents, and each of them, full power and authority to do and perform each and every act and thing requisite and necessary
to be done in connection therewith, as fully for all intents and purposes as he or she might or could do in person, hereby
ratifying and confirming all that said attorneys-in-fact and agents, or any of them, or the individual’s substitute, may
lawfully do or cause to be done by virtue hereof.
Pursuant to the requirements of the Securities Act of 1933, this Annual Report has been signed by the following
persons in the capacities and on the dates indicated.
Signature | Title | Date | |||
By: | /s/ Michael D. Schoeb | Chief Executive Officer and Director | |||
Michael D. Schoeb | (Principal Executive Officer) | March 13, 2026 | |||
By: | /s/ Dean Nolden | Chief Financial Officer | |||
Dean Nolden | (Principal Financial Officer) | March 13, 2026 | |||
By: | /s/ Brian Sikora | Chief Accounting Officer | |||
Brian Sikora | (Principal Accounting Officer) | March 13, 2026 | |||
By: | /s/ Clyde B. Anderson | ||||
Clyde B. Anderson | Director | March 13, 2026 | |||
By: | /s/ Timothy J. FitzGerald | ||||
Timothy J. FitzGerald | Director | March 13, 2026 | |||
By: | /s/ Phyllis A. Knight | ||||
Phyllis A. Knight | Director | March 13, 2026 | |||
By: | /s/ Narasimha Nayak | ||||
Narasimha Nayak | Director | March 13, 2026 | |||
By: | /s/ Robert L. Verigan | ||||
Robert L. Verigan | Director | March 13, 2026 | |||
By: | /s/ Amanda Hodges | ||||
Amanda Hodges | Director | March 13, 2026 | |||